
 Yahoo Finance
 Does Sangoma Technologies Corporation (CVE:STC) Have A Good P/E Ratio?

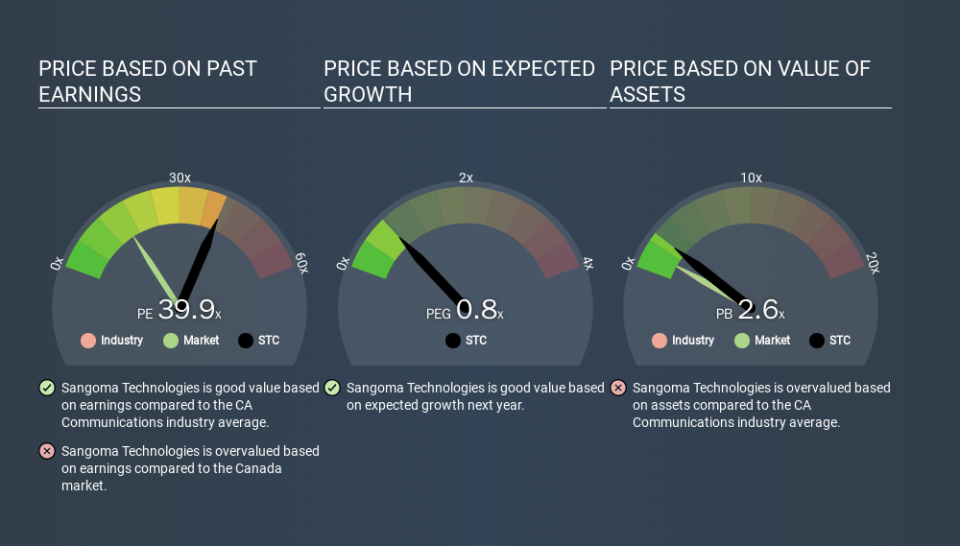
This article is for investors who would like to improve their understanding of price to earnings ratios (P/E ratios). We'll show how you can use Sangoma Technologies Corporation's (CVE:STC) P/E ratio to inform your assessment of the investment opportunity. Sangoma Technologies has a price to earnings ratio of 39.88, based on the last twelve months. In other words, at today's prices, investors are paying CA$39.88 for every CA$1 in prior year profit.
View our latest analysis for Sangoma Technologies
How Do You Calculate A P/E Ratio?
The formula for price to earnings is:
Price to Earnings Ratio = Price per Share ÷ Earnings per Share (EPS)
Or for Sangoma Technologies:
P/E of 39.88 = CAD2.49 ÷ CAD0.06 (Based on the trailing twelve months to September 2019.)
Is A High Price-to-Earnings Ratio Good?
A higher P/E ratio means that investors are paying a higher price for each CAD1 of company earnings. That is not a good or a bad thing per se, but a high P/E does imply buyers are optimistic about the future.
How Does Sangoma Technologies's P/E Ratio Compare To Its Peers?
One good way to get a quick read on what market participants expect of a company is to look at its P/E ratio. As you can see below Sangoma Technologies has a P/E ratio that is fairly close for the average for the communications industry, which is 40.3.
Its P/E ratio suggests that Sangoma Technologies shareholders think that in the future it will perform about the same as other companies in its industry classification. So if Sangoma Technologies actually outperforms its peers going forward, that should be a positive for the share price. I would further inform my view by checking insider buying and selling., among other things.
How Growth Rates Impact P/E Ratios
Probably the most important factor in determining what P/E a company trades on is the earnings growth. Earnings growth means that in the future the 'E' will be higher. Therefore, even if you pay a high multiple of earnings now, that multiple will become lower in the future. A lower P/E should indicate the stock is cheap relative to others -- and that may attract buyers.
Sangoma Technologies's earnings made like a rocket, taking off 142% last year. And earnings per share have improved by 183% annually, over the last three years. So you might say it really deserves to have an above-average P/E ratio.
Remember: P/E Ratios Don't Consider The Balance Sheet
It's important to note that the P/E ratio considers the market capitalization, not the enterprise value. That means it doesn't take debt or cash into account. In theory, a company can lower its future P/E ratio by using cash or debt to invest in growth.
While growth expenditure doesn't always pay off, the point is that it is a good option to have; but one that the P/E ratio ignores.
Is Debt Impacting Sangoma Technologies's P/E?
The extra options and safety that comes with Sangoma Technologies's CA$12m net cash position means that it deserves a higher P/E than it would if it had a lot of net debt.
The Bottom Line On Sangoma Technologies's P/E Ratio
Sangoma Technologies has a P/E of 39.9. That's higher than the average in its market, which is 15.9. The excess cash it carries is the gravy on top its fast EPS growth. To us, this is the sort of company that we would expect to carry an above average price tag (relative to earnings).
Investors should be looking to buy stocks that the market is wrong about. People often underestimate remarkable growth -- so investors can make money when fast growth is not fully appreciated. So this free report on the analyst consensus forecasts could help you make a master move on this stock.
But note: Sangoma Technologies may not be the best stock to buy. So take a peek at this free list of interesting companies with strong recent earnings growth (and a P/E ratio below 20).
If you spot an error that warrants correction, please contact the editor at editorial-team@simplywallst.com. This article by Simply Wall St is general in nature. It does not constitute a recommendation to buy or sell any stock, and does not take account of your objectives, or your financial situation. Simply Wall St has no position in the stocks mentioned.
We aim to bring you long-term focused research analysis driven by fundamental data. Note that our analysis may not factor in the latest price-sensitive company announcements or qualitative material. Thank you for reading.
