
 Yahoo Finance
 How Does Ruth's Hospitality Group's (NASDAQ:RUTH) P/E Compare To Its Industry, After The Share Price Drop?

Unfortunately for some shareholders, the Ruth's Hospitality Group (NASDAQ:RUTH) share price has dived 80% in the last thirty days. And that drop will have no doubt have some shareholders concerned that the 83% share price decline, over the last year, has turned them into bagholders. What is a bagholder? It is a shareholder who has suffered a bad loss, but continues to hold indefinitely, without questioning their reasons for holding, even as the losses grow greater.
Assuming nothing else has changed, a lower share price makes a stock more attractive to potential buyers. While the market sentiment towards a stock is very changeable, in the long run, the share price will tend to move in the same direction as earnings per share. The implication here is that long term investors have an opportunity when expectations of a company are too low. One way to gauge market expectations of a stock is to look at its Price to Earnings Ratio (PE Ratio). Investors have optimistic expectations of companies with higher P/E ratios, compared to companies with lower P/E ratios.
View our latest analysis for Ruth's Hospitality Group
How Does Ruth's Hospitality Group's P/E Ratio Compare To Its Peers?
We can tell from its P/E ratio of 3.04 that sentiment around Ruth's Hospitality Group isn't particularly high. The image below shows that Ruth's Hospitality Group has a lower P/E than the average (9.5) P/E for companies in the hospitality industry.
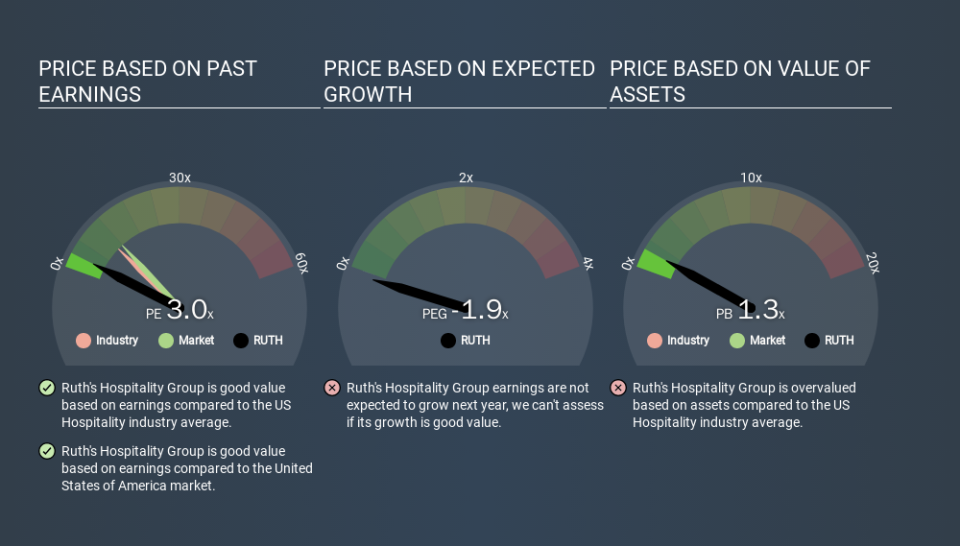
Ruth's Hospitality Group's P/E tells us that market participants think it will not fare as well as its peers in the same industry. Since the market seems unimpressed with Ruth's Hospitality Group, it's quite possible it could surprise on the upside. You should delve deeper. I like to check if company insiders have been buying or selling.
How Growth Rates Impact P/E Ratios
Probably the most important factor in determining what P/E a company trades on is the earnings growth. When earnings grow, the 'E' increases, over time. And in that case, the P/E ratio itself will drop rather quickly. And as that P/E ratio drops, the company will look cheap, unless its share price increases.
Ruth's Hospitality Group saw earnings per share improve by 3.9% last year. And earnings per share have improved by 14% annually, over the last five years.
A Limitation: P/E Ratios Ignore Debt and Cash In The Bank
Don't forget that the P/E ratio considers market capitalization. Thus, the metric does not reflect cash or debt held by the company. Hypothetically, a company could reduce its future P/E ratio by spending its cash (or taking on debt) to achieve higher earnings.
Spending on growth might be good or bad a few years later, but the point is that the P/E ratio does not account for the option (or lack thereof).
Ruth's Hospitality Group's Balance Sheet
Net debt totals 50% of Ruth's Hospitality Group's market cap. If you want to compare its P/E ratio to other companies, you should absolutely keep in mind it has significant borrowings.
The Bottom Line On Ruth's Hospitality Group's P/E Ratio
Ruth's Hospitality Group's P/E is 3.0 which is below average (11.5) in the US market. It's good to see EPS growth in the last 12 months, but the debt on the balance sheet might be muting expectations. Given Ruth's Hospitality Group's P/E ratio has declined from 15.4 to 3.0 in the last month, we know for sure that the market is more worried about the business today, than it was back then. For those who prefer invest in growth, this stock apparently offers limited promise, but the deep value investors may find the pessimism around this stock enticing.
Investors have an opportunity when market expectations about a stock are wrong. If the reality for a company is not as bad as the P/E ratio indicates, then the share price should increase as the market realizes this. So this free report on the analyst consensus forecasts could help you make a master move on this stock.
Of course you might be able to find a better stock than Ruth's Hospitality Group. So you may wish to see this free collection of other companies that have grown earnings strongly.
If you spot an error that warrants correction, please contact the editor at editorial-team@simplywallst.com. This article by Simply Wall St is general in nature. It does not constitute a recommendation to buy or sell any stock, and does not take account of your objectives, or your financial situation. Simply Wall St has no position in the stocks mentioned.
We aim to bring you long-term focused research analysis driven by fundamental data. Note that our analysis may not factor in the latest price-sensitive company announcements or qualitative material. Thank you for reading.
