
 Yahoo Finance
 What Does Return Energy Inc’s (CVE:RTN) Ownership Structure Look Like?
Every investor in Return Energy Inc (CVE:RTN) should be aware of the most powerful shareholder groups. Institutions will often hold stock in bigger companies, and we expect to see insiders owning a noticeable percentage of the smaller ones. We also tend to see lower insider ownership in companies that were previously publicly owned.
Return Energy is not a large company by global standards. It has a market capitalization of CA$4.4m, which means it wouldn’t have the attention of many institutional investors. In the chart below below, we can see that institutions own shares in the company. We can zoom in on the different ownership groups, to learn more about RTN.
View our latest analysis for Return Energy

What Does The Institutional Ownership Tell Us About Return Energy?
Institutional investors commonly compare their own returns to the returns of a commonly followed index. So they generally do consider buying larger companies that are included in the relevant benchmark index.
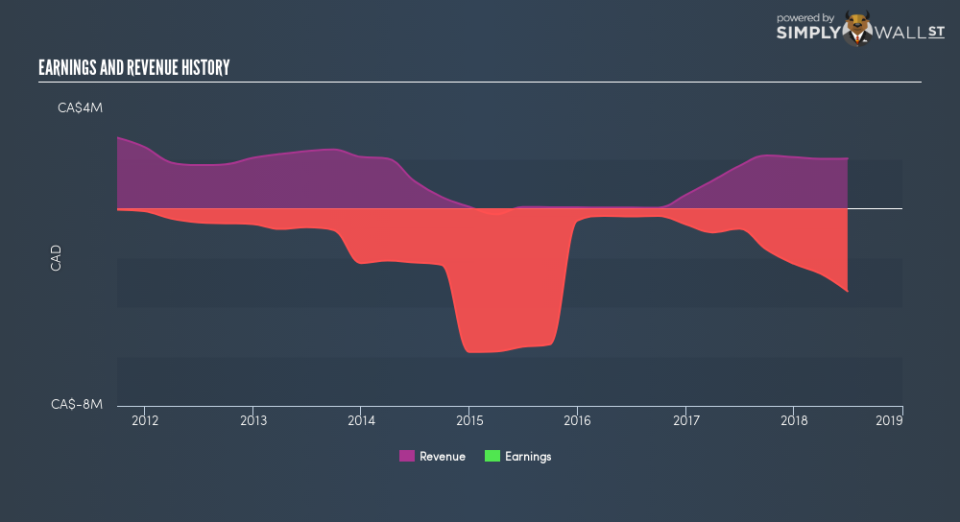
We can see that Return Energy does have institutional investors; and they hold 68.5% of the stock. This suggests some credibility amongst professional investors. But we can’t rely on that fact alone, since institutions make bad investments sometimes, just like everyone does. When multiple institutions own a stock, there’s always a risk that they are in a ‘crowded trade’. When such a trade goes wrong, multiple parties may compete to sell stock fast. This risk is higher in a company without a history of growth. You can see Return Energy’s historic earnings and revenue, below, but keep in mind there’s always more to the story.
Institutional investors own over 50% of the company, so together than can probably strongly influence board decisions. We note that hedge funds don’t have a meaningful investment in Return Energy. As far I can tell there isn’t analyst coverage of the company, so it is probably flying under the radar.
Insider Ownership Of Return Energy
The definition of an insider can differ slightly between different countries, but members of the board of directors always count. Management ultimately answers to the board. However, it is not uncommon for managers to be executive board members, especially if they are a founder or the CEO.
I generally consider insider ownership to be a good thing. However, on some occasions it makes it more difficult for other shareholders to hold the board accountable for decisions.
We can see that insiders own shares in Return Energy Inc. It has a market capitalization of just CA$4.4m, and insiders have CA$115.7k worth of shares, in their own names. Some would say this shows alignment of interests between shareholders and the board, though I generally prefer to see bigger insider holdings. But it might be worth checking if those insiders have been selling.
General Public Ownership
The general public holds a 28.9% stake in RTN. While this size of ownership may not be enough to sway a policy decision in their favour, they can still make a collective impact on company policies.
Next Steps:
I find it very interesting to look at who exactly owns a company. But to truly gain insight, we need to consider other information, too.
I always like to check for a history of revenue growth. You can too, by accessing this free chart of historic revenue and earnings in this detailed graph.
If you would prefer check out another company — one with potentially superior financials — then do not miss this free free list of interesting companies, backed by strong financial data.
NB: Figures in this article are calculated using data from the last twelve months, which refer to the 12-month period ending on the last date of the month the financial statement is dated. This may not be consistent with full year annual report figures.
To help readers see past the short term volatility of the financial market, we aim to bring you a long-term focused research analysis purely driven by fundamental data. Note that our analysis does not factor in the latest price-sensitive company announcements.
The author is an independent contributor and at the time of publication had no position in the stocks mentioned. For errors that warrant correction please contact the editor at editorial-team@simplywallst.com.
