
 Yahoo Finance
 Does Radient Technologies Inc. (CVE:RTI) Have A High Beta?

Anyone researching Radient Technologies Inc. (CVE:RTI) might want to consider the historical volatility of the share price. Modern finance theory considers volatility to be a measure of risk, and there are two main types of price volatility. First, we have company specific volatility, which is the price gyrations of an individual stock. Holding at least 8 stocks can reduce this kind of risk across a portfolio. The second sort is caused by the natural volatility of markets, overall. For example, certain macroeconomic events will impact (virtually) all stocks on the market.
Some stocks see their prices move in concert with the market. Others tend towards stronger, gentler or unrelated price movements. Beta is a widely used metric to measure a stock's exposure to market risk (volatility). Before we go on, it's worth noting that Warren Buffett pointed out in his 2014 letter to shareholders that 'volatility is far from synonymous with risk.' Having said that, beta can still be rather useful. The first thing to understand about beta is that the beta of the overall market is one. Any stock with a beta of greater than one is considered more volatile than the market, while those with a beta below one are either less volatile or poorly correlated with the market.
Check out our latest analysis for Radient Technologies
What we can learn from RTI's beta value
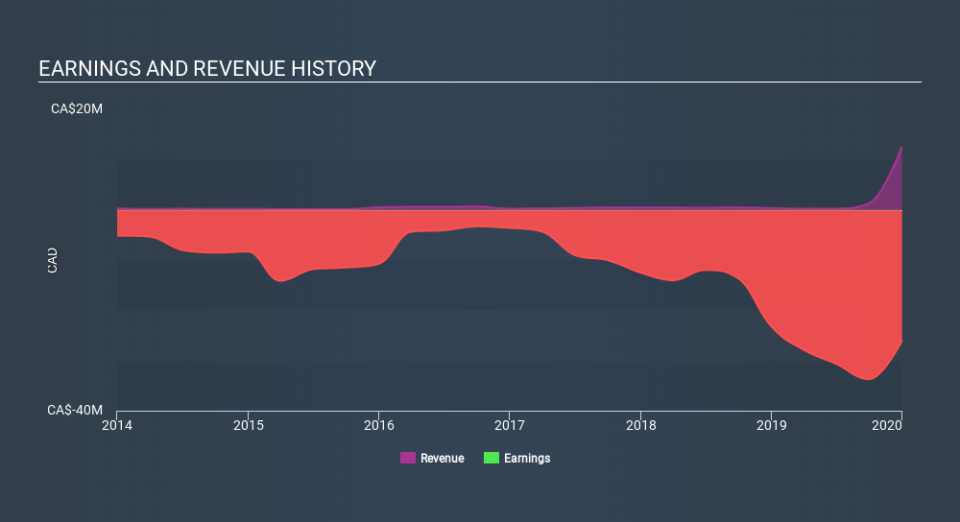
Zooming in on Radient Technologies, we see it has a five year beta of 1.79. This is above 1, so historically its share price has been influenced by the broader volatility of the stock market. If the past is any guide, we would expect that Radient Technologies shares will rise quicker than the markets in times of optimism, but fall faster in times of pessimism. Many would argue that beta is useful in position sizing, but fundamental metrics such as revenue and earnings are more important overall. You can see Radient Technologies's revenue and earnings in the image below.
Could RTI's size cause it to be more volatile?
With a market capitalisation of CA$36m, Radient Technologies is a very small company by global standards. It is quite likely to be unknown to most investors. It takes less money to influence the share price of a very small company. This may explain the excess volatility implied by this beta value.
What this means for you:
Beta only tells us that the Radient Technologies share price is sensitive to broader market movements. This could indicate that it is a high growth company, or is heavily influenced by sentiment because it is speculative. Alternatively, it could have operating leverage in its business model. Ultimately, beta is an interesting metric, but there's plenty more to learn. In order to fully understand whether RTI is a good investment for you, we also need to consider important company-specific fundamentals such as Radient Technologies’s financial health and performance track record. I highly recommend you dive deeper by considering the following:
Financial Health: Are RTI’s operations financially sustainable? Balance sheets can be hard to analyze, which is why we’ve done it for you. Check out our financial health checks here.
Past Track Record: Has RTI been consistently performing well irrespective of the ups and downs in the market? Go into more detail in the past performance analysis and take a look at the free visual representations of RTI's historicals for more clarity.
Other High-Performing Stocks: Are there other stocks that provide better prospects with proven track records? Explore our free list of these great stocks here.
If you spot an error that warrants correction, please contact the editor at editorial-team@simplywallst.com. This article by Simply Wall St is general in nature. It does not constitute a recommendation to buy or sell any stock, and does not take account of your objectives, or your financial situation. Simply Wall St has no position in the stocks mentioned.
We aim to bring you long-term focused research analysis driven by fundamental data. Note that our analysis may not factor in the latest price-sensitive company announcements or qualitative material. Thank you for reading.