
 Yahoo Finance
 How Does Portmeirion Group's (LON:PMP) P/E Compare To Its Industry, After The Share Price Drop?

To the annoyance of some shareholders, Portmeirion Group (LON:PMP) shares are down a considerable 63% in the last month. And that drop will have no doubt have some shareholders concerned that the 74% share price decline, over the last year, has turned them into bagholders. For those wondering, a bagholder is someone who keeps holding a losing stock indefinitely, without taking the time to consider its prospects carefully, going forward.
All else being equal, a share price drop should make a stock more attractive to potential investors. In the long term, share prices tend to follow earnings per share, but in the short term prices bounce around in response to short term factors (which are not always obvious). So, on certain occasions, long term focussed investors try to take advantage of pessimistic expectations to buy shares at a better price. One way to gauge market expectations of a stock is to look at its Price to Earnings Ratio (PE Ratio). A high P/E ratio means that investors have a high expectation about future growth, while a low P/E ratio means they have low expectations about future growth.
View our latest analysis for Portmeirion Group
Does Portmeirion Group Have A Relatively High Or Low P/E For Its Industry?
Portmeirion Group's P/E of 5.12 indicates relatively low sentiment towards the stock. We can see in the image below that the average P/E (7.3) for companies in the consumer durables industry is higher than Portmeirion Group's P/E.
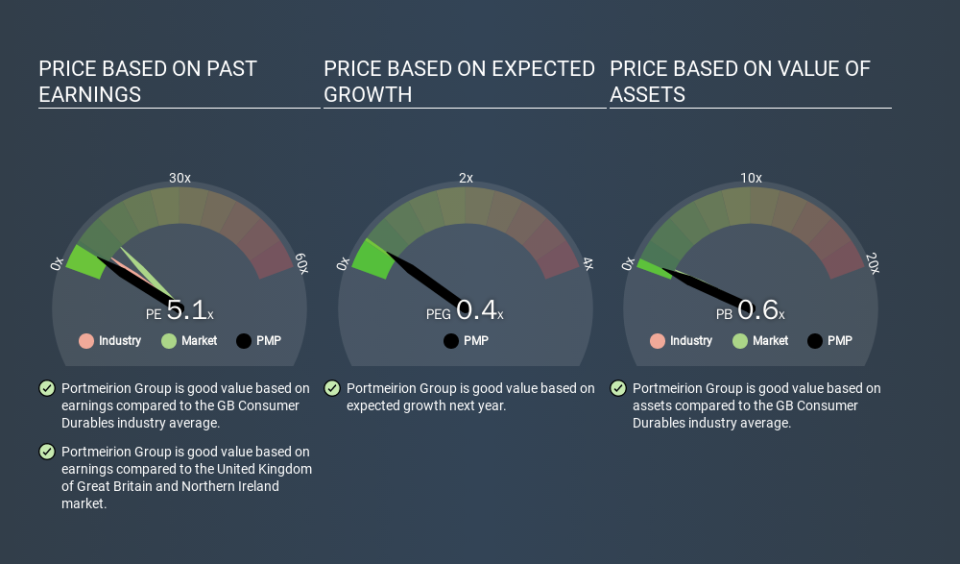
Its relatively low P/E ratio indicates that Portmeirion Group shareholders think it will struggle to do as well as other companies in its industry classification. Since the market seems unimpressed with Portmeirion Group, it's quite possible it could surprise on the upside. It is arguably worth checking if insiders are buying shares, because that might imply they believe the stock is undervalued.
How Growth Rates Impact P/E Ratios
If earnings fall then in the future the 'E' will be lower. Therefore, even if you pay a low multiple of earnings now, that multiple will become higher in the future. So while a stock may look cheap based on past earnings, it could be expensive based on future earnings.
Portmeirion Group shrunk earnings per share by 24% over the last year. And EPS is down 1.1% a year, over the last 5 years. This might lead to muted expectations.
Don't Forget: The P/E Does Not Account For Debt or Bank Deposits
Don't forget that the P/E ratio considers market capitalization. So it won't reflect the advantage of cash, or disadvantage of debt. Hypothetically, a company could reduce its future P/E ratio by spending its cash (or taking on debt) to achieve higher earnings.
Such spending might be good or bad, overall, but the key point here is that you need to look at debt to understand the P/E ratio in context.
So What Does Portmeirion Group's Balance Sheet Tell Us?
Net debt is 41% of Portmeirion Group's market cap. While it's worth keeping this in mind, it isn't a worry.
The Bottom Line On Portmeirion Group's P/E Ratio
Portmeirion Group's P/E is 5.1 which is below average (11.8) in the GB market. With only modest debt, it's likely the lack of EPS growth at least partially explains the pessimism implied by the P/E ratio. Given Portmeirion Group's P/E ratio has declined from 13.7 to 5.1 in the last month, we know for sure that the market is more worried about the business today, than it was back then. For those who prefer invest in growth, this stock apparently offers limited promise, but the deep value investors may find the pessimism around this stock enticing.
Investors have an opportunity when market expectations about a stock are wrong. As value investor Benjamin Graham famously said, 'In the short run, the market is a voting machine but in the long run, it is a weighing machine. So this free visualization of the analyst consensus on future earnings could help you make the right decision about whether to buy, sell, or hold.
Of course you might be able to find a better stock than Portmeirion Group. So you may wish to see this free collection of other companies that have grown earnings strongly.
If you spot an error that warrants correction, please contact the editor at editorial-team@simplywallst.com. This article by Simply Wall St is general in nature. It does not constitute a recommendation to buy or sell any stock, and does not take account of your objectives, or your financial situation. Simply Wall St has no position in the stocks mentioned.
We aim to bring you long-term focused research analysis driven by fundamental data. Note that our analysis may not factor in the latest price-sensitive company announcements or qualitative material. Thank you for reading.
