
 Yahoo Finance
 How Does PNC Financial Services Group's (NYSE:PNC) P/E Compare To Its Industry, After The Share Price Drop?

To the annoyance of some shareholders, PNC Financial Services Group (NYSE:PNC) shares are down a considerable 34% in the last month. Even longer term holders have taken a real hit with the stock declining 20% in the last year.
All else being equal, a share price drop should make a stock more attractive to potential investors. In the long term, share prices tend to follow earnings per share, but in the short term prices bounce around in response to short term factors (which are not always obvious). So, on certain occasions, long term focussed investors try to take advantage of pessimistic expectations to buy shares at a better price. Perhaps the simplest way to get a read on investors' expectations of a business is to look at its Price to Earnings Ratio (PE Ratio). Investors have optimistic expectations of companies with higher P/E ratios, compared to companies with lower P/E ratios.
See our latest analysis for PNC Financial Services Group
How Does PNC Financial Services Group's P/E Ratio Compare To Its Peers?
We can tell from its P/E ratio of 8.89 that sentiment around PNC Financial Services Group isn't particularly high. The image below shows that PNC Financial Services Group has a lower P/E than the average (10.5) P/E for companies in the banks industry.
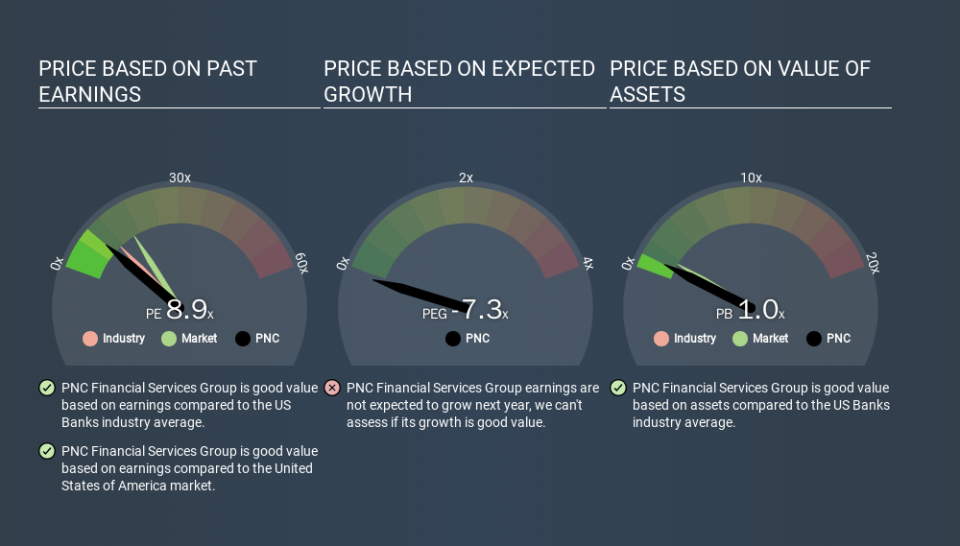
Its relatively low P/E ratio indicates that PNC Financial Services Group shareholders think it will struggle to do as well as other companies in its industry classification. Since the market seems unimpressed with PNC Financial Services Group, it's quite possible it could surprise on the upside. If you consider the stock interesting, further research is recommended. For example, I often monitor director buying and selling.
How Growth Rates Impact P/E Ratios
P/E ratios primarily reflect market expectations around earnings growth rates. When earnings grow, the 'E' increases, over time. That means unless the share price increases, the P/E will reduce in a few years. And as that P/E ratio drops, the company will look cheap, unless its share price increases.
PNC Financial Services Group saw earnings per share improve by -5.9% last year. And its annual EPS growth rate over 5 years is 9.0%.
Remember: P/E Ratios Don't Consider The Balance Sheet
The 'Price' in P/E reflects the market capitalization of the company. That means it doesn't take debt or cash into account. In theory, a company can lower its future P/E ratio by using cash or debt to invest in growth.
Such spending might be good or bad, overall, but the key point here is that you need to look at debt to understand the P/E ratio in context.
How Does PNC Financial Services Group's Debt Impact Its P/E Ratio?
Net debt totals a substantial 118% of PNC Financial Services Group's market cap. If you want to compare its P/E ratio to other companies, you must keep in mind that these debt levels would usually warrant a relatively low P/E.
The Bottom Line On PNC Financial Services Group's P/E Ratio
PNC Financial Services Group has a P/E of 8.9. That's below the average in the US market, which is 15.1. It's good to see EPS growth in the last 12 months, but the debt on the balance sheet might be muting expectations. What can be absolutely certain is that the market has become more pessimistic about PNC Financial Services Group over the last month, with the P/E ratio falling from 13.4 back then to 8.9 today. For those who prefer invest in growth, this stock apparently offers limited promise, but the deep value investors may find the pessimism around this stock enticing.
When the market is wrong about a stock, it gives savvy investors an opportunity. If the reality for a company is not as bad as the P/E ratio indicates, then the share price should increase as the market realizes this. So this free report on the analyst consensus forecasts could help you make a master move on this stock.
Of course, you might find a fantastic investment by looking at a few good candidates. So take a peek at this free list of companies with modest (or no) debt, trading on a P/E below 20.
If you spot an error that warrants correction, please contact the editor at editorial-team@simplywallst.com. This article by Simply Wall St is general in nature. It does not constitute a recommendation to buy or sell any stock, and does not take account of your objectives, or your financial situation. Simply Wall St has no position in the stocks mentioned.
We aim to bring you long-term focused research analysis driven by fundamental data. Note that our analysis may not factor in the latest price-sensitive company announcements or qualitative material. Thank you for reading.
