
 Yahoo Finance
 How Does Omnicom Group Inc. (NYSE:OMC) Stand Up To These Simple Dividend Safety Checks?

Dividend paying stocks like Omnicom Group Inc. (NYSE:OMC) tend to be popular with investors, and for good reason - some research suggests a significant amount of all stock market returns come from reinvested dividends. If you are hoping to live on your dividends, it's important to be more stringent with your investments than the average punter. Regular readers know we like to apply the same approach to each dividend stock, and we hope you'll find our analysis useful.
In this case, Omnicom Group likely looks attractive to investors, given its 3.3% dividend yield and a payment history of over ten years. It would not be a surprise to discover that many investors buy it for the dividends. The company also returned around 3.5% of its market capitalisation to shareholders in the form of stock buybacks over the past year. Some simple research can reduce the risk of buying Omnicom Group for its dividend - read on to learn more.
Explore this interactive chart for our latest analysis on Omnicom Group!
Payout ratios
Dividends are typically paid from company earnings. If a company pays more in dividends than it earned, then the dividend might become unsustainable - hardly an ideal situation. As a result, we should always investigate whether a company can afford its dividend, measured as a percentage of a company's net income after tax. Omnicom Group paid out 43% of its profit as dividends, over the trailing twelve month period. This is a middling range that strikes a nice balance between paying dividends to shareholders, and retaining enough earnings to invest in future growth. One of the risks is that management reinvests the retained capital poorly instead of paying a higher dividend.
In addition to comparing dividends against profits, we should inspect whether the company generated enough cash to pay its dividend. Omnicom Group paid out a conservative 35% of its free cash flow as dividends last year. It's positive to see that Omnicom Group's dividend is covered by both profits and cash flow, since this is generally a sign that the dividend is sustainable, and a lower payout ratio usually suggests a greater margin of safety before the dividend gets cut.
We update our data on Omnicom Group every 24 hours, so you can always get our latest analysis of its financial health, here.
Dividend Volatility
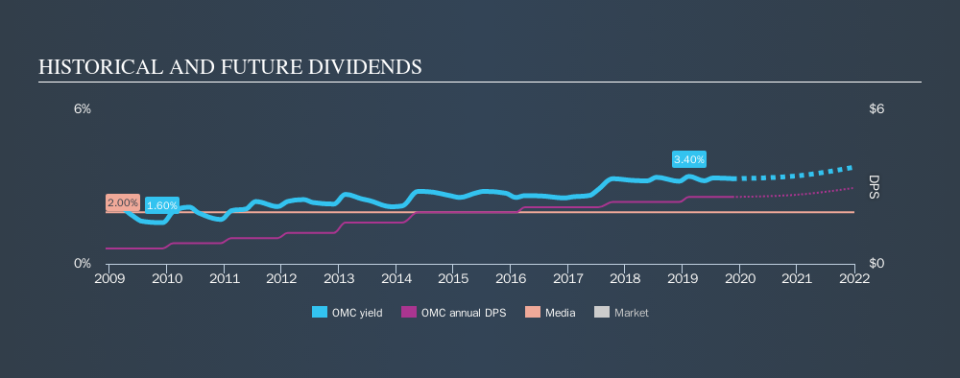
From the perspective of an income investor who wants to earn dividends for many years, there is not much point buying a stock if its dividend is regularly cut or is not reliable. For the purpose of this article, we only scrutinise the last decade of Omnicom Group's dividend payments. The dividend has been stable over the past 10 years, which is great. We think this could suggest some resilience to the business and its dividends. During the past ten-year period, the first annual payment was US$0.60 in 2009, compared to US$2.60 last year. Dividends per share have grown at approximately 16% per year over this time.
With rapid dividend growth and no notable cuts to the dividend over a lengthy period of time, we think this company has a lot going for it.
Dividend Growth Potential
While dividend payments have been relatively reliable, it would also be nice if earnings per share (EPS) were growing, as this is essential to maintaining the dividend's purchasing power over the long term. Earnings have grown at around 9.9% a year for the past five years, which is better than seeing them shrink! It's good to see decent earnings growth and a low payout ratio. Companies with these characteristics often display the fastest dividend growth over the long term - assuming earnings can be maintained, of course.
Conclusion
To summarise, shareholders should always check that Omnicom Group's dividends are affordable, that its dividend payments are relatively stable, and that it has decent prospects for growing its earnings and dividend. Firstly, we like that Omnicom Group has low and conservative payout ratios. Next, growing earnings per share and steady dividend payments is a great combination. All these things considered, we think this organisation has a lot going for it from a dividend perspective.
Earnings growth generally bodes well for the future value of company dividend payments. See if the 12 Omnicom Group analysts we track are forecasting continued growth with our free report on analyst estimates for the company.
Looking for more high-yielding dividend ideas? Try our curated list of dividend stocks with a yield above 3%.
We aim to bring you long-term focused research analysis driven by fundamental data. Note that our analysis may not factor in the latest price-sensitive company announcements or qualitative material.
If you spot an error that warrants correction, please contact the editor at editorial-team@simplywallst.com. This article by Simply Wall St is general in nature. It does not constitute a recommendation to buy or sell any stock, and does not take account of your objectives, or your financial situation. Simply Wall St has no position in the stocks mentioned. Thank you for reading.
