
 Yahoo Finance
 Does Occidental Petroleum Corporation's (NYSE:OXY) P/E Ratio Signal A Buying Opportunity?

This article is written for those who want to get better at using price to earnings ratios (P/E ratios). We'll look at Occidental Petroleum Corporation's (NYSE:OXY) P/E ratio and reflect on what it tells us about the company's share price. Based on the last twelve months, Occidental Petroleum's P/E ratio is 8.48. That means that at current prices, buyers pay $8.48 for every $1 in trailing yearly profits.
See our latest analysis for Occidental Petroleum
How Do You Calculate Occidental Petroleum's P/E Ratio?
The formula for P/E is:
Price to Earnings Ratio = Price per Share ÷ Earnings per Share (EPS)
Or for Occidental Petroleum:
P/E of 8.48 = $43.07 ÷ $5.08 (Based on the trailing twelve months to June 2019.)
Is A High P/E Ratio Good?
A higher P/E ratio means that buyers have to pay a higher price for each $1 the company has earned over the last year. That isn't a good or a bad thing on its own, but a high P/E means that buyers have a higher opinion of the business's prospects, relative to stocks with a lower P/E.
How Does Occidental Petroleum's P/E Ratio Compare To Its Peers?
The P/E ratio indicates whether the market has higher or lower expectations of a company. The image below shows that Occidental Petroleum has a lower P/E than the average (9.9) P/E for companies in the oil and gas industry.
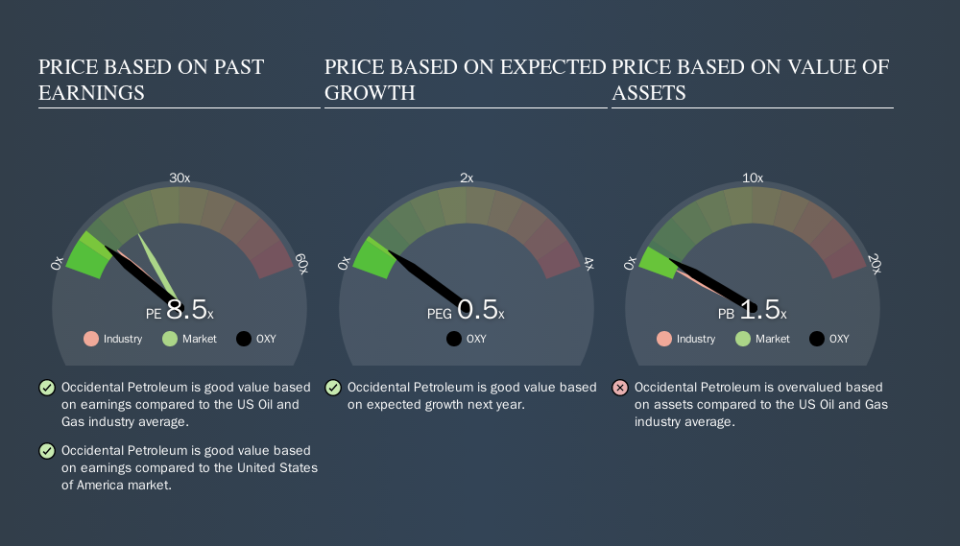
This suggests that market participants think Occidental Petroleum will underperform other companies in its industry. Many investors like to buy stocks when the market is pessimistic about their prospects. If you consider the stock interesting, further research is recommended. For example, I often monitor director buying and selling.
How Growth Rates Impact P/E Ratios
Probably the most important factor in determining what P/E a company trades on is the earnings growth. If earnings are growing quickly, then the 'E' in the equation will increase faster than it would otherwise. And in that case, the P/E ratio itself will drop rather quickly. So while a stock may look expensive based on past earnings, it could be cheap based on future earnings.
Occidental Petroleum's earnings made like a rocket, taking off 74% last year. Unfortunately, earnings per share are down 2.3% a year, over 5 years.
A Limitation: P/E Ratios Ignore Debt and Cash In The Bank
Don't forget that the P/E ratio considers market capitalization. So it won't reflect the advantage of cash, or disadvantage of debt. Theoretically, a business can improve its earnings (and produce a lower P/E in the future) by investing in growth. That means taking on debt (or spending its cash).
Such expenditure might be good or bad, in the long term, but the point here is that the balance sheet is not reflected by this ratio.
So What Does Occidental Petroleum's Balance Sheet Tell Us?
Occidental Petroleum's net debt is 22% of its market cap. That's enough debt to impact the P/E ratio a little; so keep it in mind if you're comparing it to companies without debt.
The Verdict On Occidental Petroleum's P/E Ratio
Occidental Petroleum has a P/E of 8.5. That's below the average in the US market, which is 17.6. The company does have a little debt, and EPS growth was good last year. If it continues to grow, then the current low P/E may prove to be unjustified.
Investors should be looking to buy stocks that the market is wrong about. If it is underestimating a company, investors can make money by buying and holding the shares until the market corrects itself. So this free report on the analyst consensus forecasts could help you make a master move on this stock.
Of course, you might find a fantastic investment by looking at a few good candidates. So take a peek at this free list of companies with modest (or no) debt, trading on a P/E below 20.
We aim to bring you long-term focused research analysis driven by fundamental data. Note that our analysis may not factor in the latest price-sensitive company announcements or qualitative material.
If you spot an error that warrants correction, please contact the editor at editorial-team@simplywallst.com. This article by Simply Wall St is general in nature. It does not constitute a recommendation to buy or sell any stock, and does not take account of your objectives, or your financial situation. Simply Wall St has no position in the stocks mentioned. Thank you for reading.
