
 Yahoo Finance
 Does NCI Building Systems Inc’s (NYSE:NCS) PE Ratio Signal A Selling Opportunity?

The content of this article will benefit those of you who are starting to educate yourself about investing in the stock market and want to begin learning about how to value company based on its current earnings and what are the drawbacks of this method.
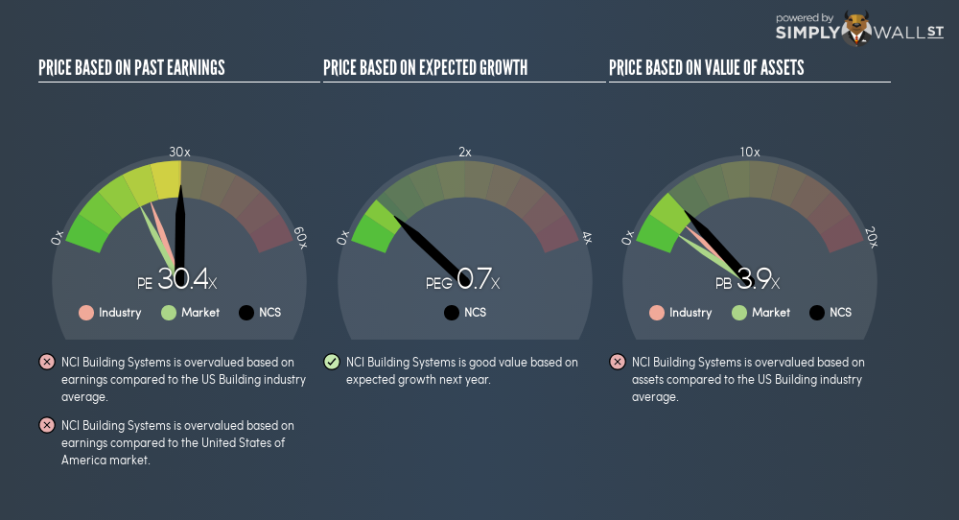
NCI Building Systems Inc (NYSE:NCS) is currently trading at a trailing P/E of 30.4, which is higher than the industry average of 21.7. Though this might seem to be a negative, you might change your mind after I explain the assumptions behind the P/E ratio. In this article, I will explain what the P/E ratio is as well as what you should look out for when using it.
Check out our latest analysis for NCI Building Systems
Breaking down the Price-Earnings ratio
P/E is a popular ratio used for relative valuation. It compares a stock’s price per share to the stock’s earnings per share. A more intuitive way of understanding the P/E ratio is to think of it as how much investors are paying for each dollar of the company’s earnings.
P/E Calculation for NCS
Price-Earnings Ratio = Price per share ÷ Earnings per share
NCS Price-Earnings Ratio = $15.6 ÷ $0.514 = 30.4x
The P/E ratio isn’t a metric you view in isolation and only becomes useful when you compare it against other similar companies. We want to compare the stock’s P/E ratio to the average of companies that have similar characteristics as NCS, such as size and country of operation. A quick method of creating a peer group is to use companies in the same industry, which is what I will do. NCS’s P/E of 30.4 is higher than its industry peers (21.7), which implies that each dollar of NCS’s earnings is being overvalued by investors. This multiple is a median of profitable companies of 25 Building companies in US including Noda, Compagnie de Saint-Gobain and Compagnie de Saint-Gobain. You could think of it like this: the market is pricing NCS as if it is a stronger company than the average of its industry group.
A few caveats
However, you should be aware that this analysis makes certain assumptions. The first is that our “similar companies” are actually similar to NCS. If not, the difference in P/E might be a result of other factors. For example, if NCI Building Systems Inc is growing faster than its peers, then it would deserve a higher P/E ratio. We should also be aware that the stocks we are comparing to NCS may not be fairly valued. So while we can reasonably surmise that it is optimistically valued relative to a peer group, it might be fairly valued, if the peer group is undervalued.
What this means for you:
You may have already conducted fundamental analysis on the stock as a shareholder, so its current overvaluation could signal a potential selling opportunity to reduce your exposure to NCS. Now that you understand the ins and outs of the PE metric, you should know to bear in mind its limitations before you make an investment decision. Remember that basing your investment decision off one metric alone is certainly not sufficient. There are many things I have not taken into account in this article and the PE ratio is very one-dimensional. If you have not done so already, I urge you to complete your research by taking a look at the following:
Future Outlook: What are well-informed industry analysts predicting for NCS’s future growth? Take a look at our free research report of analyst consensus for NCS’s outlook.
Past Track Record: Has NCS been consistently performing well irrespective of the ups and downs in the market? Go into more detail in the past performance analysis and take a look at the free visual representations of NCS’s historicals for more clarity.
Other High-Performing Stocks: Are there other stocks that provide better prospects with proven track records? Explore our free list of these great stocks here.
To help readers see past the short term volatility of the financial market, we aim to bring you a long-term focused research analysis purely driven by fundamental data. Note that our analysis does not factor in the latest price-sensitive company announcements.
The author is an independent contributor and at the time of publication had no position in the stocks mentioned. For errors that warrant correction please contact the editor at editorial-team@simplywallst.com.
