
 Yahoo Finance
 How Does Metalore Resources's (CVE:MET) P/E Compare To Its Industry, After Its Big Share Price Gain?

Metalore Resources (CVE:MET) shareholders are no doubt pleased to see that the share price has bounced 31% in the last month alone, although it is still down 16% over the last quarter. The full year gain of 20% is pretty reasonable, too.
All else being equal, a sharp share price increase should make a stock less attractive to potential investors. While the market sentiment towards a stock is very changeable, in the long run, the share price will tend to move in the same direction as earnings per share. The implication here is that deep value investors might steer clear when expectations of a company are too high. Perhaps the simplest way to get a read on investors' expectations of a business is to look at its Price to Earnings Ratio (PE Ratio). Investors have optimistic expectations of companies with higher P/E ratios, compared to companies with lower P/E ratios.
See our latest analysis for Metalore Resources
How Does Metalore Resources's P/E Ratio Compare To Its Peers?
Metalore Resources has a P/E ratio of 11.13. You can see in the image below that the average P/E (11.1) for companies in the oil and gas industry is roughly the same as Metalore Resources's P/E.
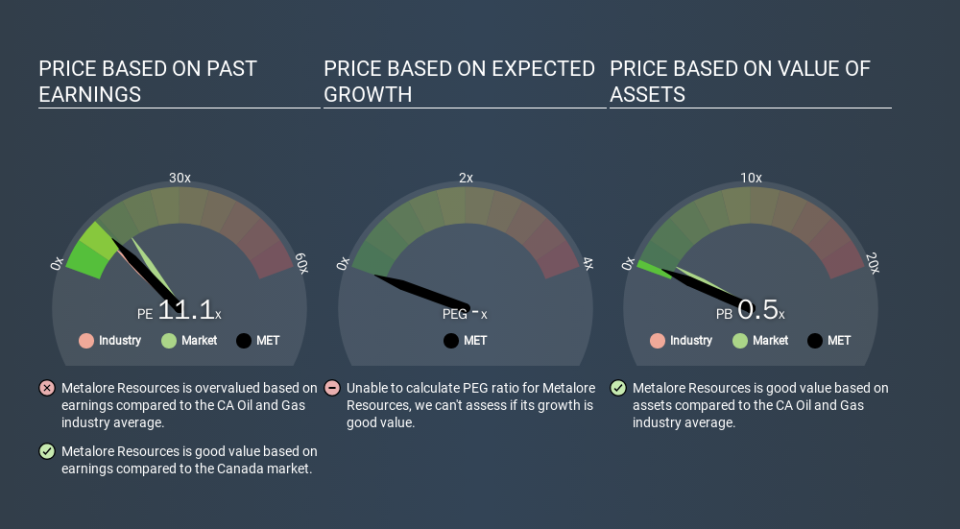
Metalore Resources's P/E tells us that market participants think its prospects are roughly in line with its industry. The company could surprise by performing better than average, in the future. I would further inform my view by checking insider buying and selling., among other things.
How Growth Rates Impact P/E Ratios
Probably the most important factor in determining what P/E a company trades on is the earnings growth. Earnings growth means that in the future the 'E' will be higher. Therefore, even if you pay a high multiple of earnings now, that multiple will become lower in the future. Then, a lower P/E should attract more buyers, pushing the share price up.
Most would be impressed by Metalore Resources earnings growth of 19% in the last year. Unfortunately, earnings per share are down 7.5% a year, over 5 years.
A Limitation: P/E Ratios Ignore Debt and Cash In The Bank
It's important to note that the P/E ratio considers the market capitalization, not the enterprise value. That means it doesn't take debt or cash into account. The exact same company would hypothetically deserve a higher P/E ratio if it had a strong balance sheet, than if it had a weak one with lots of debt, because a cashed up company can spend on growth.
Such spending might be good or bad, overall, but the key point here is that you need to look at debt to understand the P/E ratio in context.
Metalore Resources's Balance Sheet
With net cash of CA$573k, Metalore Resources has a very strong balance sheet, which may be important for its business. Having said that, at 15% of its market capitalization the cash hoard would contribute towards a higher P/E ratio.
The Verdict On Metalore Resources's P/E Ratio
Metalore Resources has a P/E of 11.1. That's below the average in the CA market, which is 15.4. It grew its EPS nicely over the last year, and the healthy balance sheet implies there is more potential for growth. The relatively low P/E ratio implies the market is pessimistic. What is very clear is that the market has become more optimistic about Metalore Resources over the last month, with the P/E ratio rising from 8.5 back then to 11.1 today. For those who prefer to invest with the flow of momentum, that might mean it's time to put the stock on a watchlist, or research it. But the contrarian may see it as a missed opportunity.
Investors have an opportunity when market expectations about a stock are wrong. As value investor Benjamin Graham famously said, 'In the short run, the market is a voting machine but in the long run, it is a weighing machine. We don't have analyst forecasts, but shareholders might want to examine this detailed historical graph of earnings, revenue and cash flow.
But note: Metalore Resources may not be the best stock to buy. So take a peek at this free list of interesting companies with strong recent earnings growth (and a P/E ratio below 20).
If you spot an error that warrants correction, please contact the editor at editorial-team@simplywallst.com. This article by Simply Wall St is general in nature. It does not constitute a recommendation to buy or sell any stock, and does not take account of your objectives, or your financial situation. Simply Wall St has no position in the stocks mentioned.
We aim to bring you long-term focused research analysis driven by fundamental data. Note that our analysis may not factor in the latest price-sensitive company announcements or qualitative material. Thank you for reading.
