
 Yahoo Finance
 Does MedMira Inc.'s (CVE:MIR) CEO Pay Matter?

In 2006 Hermes Chan was appointed CEO of MedMira Inc. (CVE:MIR). First, this article will compare CEO compensation with compensation at similar sized companies. Next, we'll consider growth that the business demonstrates. Third, we'll reflect on the total return to shareholders over three years, as a second measure of business performance. This process should give us an idea about how appropriately the CEO is paid.
Check out our latest analysis for MedMira
How Does Hermes Chan's Compensation Compare With Similar Sized Companies?
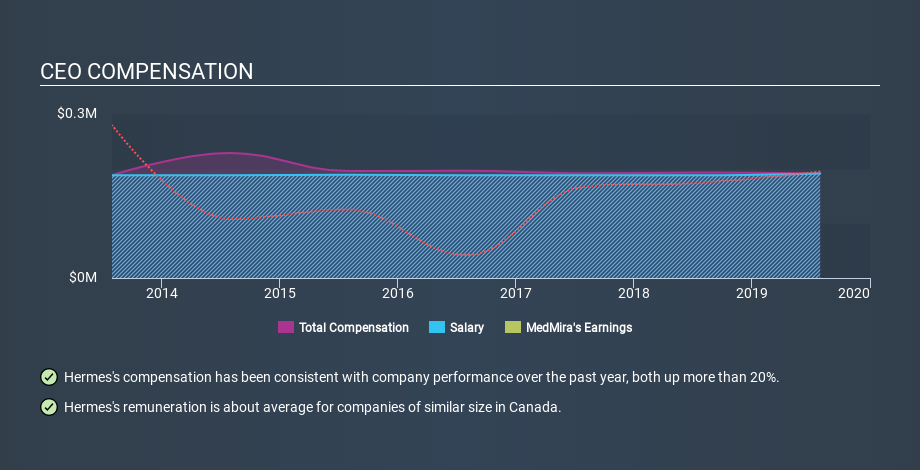
At the time of writing, our data says that MedMira Inc. has a market cap of CA$13m, and reported total annual CEO compensation of CA$191k for the year to July 2019. It is worth noting that the CEO compensation consists almost entirely of the salary, worth CA$191k. We took a group of companies with market capitalizations below CA$290m, and calculated the median CEO total compensation to be CA$225k.
Now let's take a look at the pay mix on an industry and company level to gain a better understanding of where MedMira stands. On an industry level, roughly 80% of total compensation represents salary and 20% is other remuneration. MedMira is largely mirroring the industry average when it comes to the share a salary enjoys in overall compensation
So Hermes Chan receives a similar amount to the median CEO pay, amongst the companies we looked at. Although this fact alone doesn't tell us a great deal, it becomes more relevant when considered against the business performance. You can see a visual representation of the CEO compensation at MedMira, below.
Is MedMira Inc. Growing?
Over the last three years MedMira Inc. has grown its earnings per share (EPS) by an average of 30% per year (using a line of best fit). It saw its revenue drop 23% over the last year.
This shows that the company has improved itself over the last few years. Good news for shareholders. The lack of revenue growth isn't ideal, but it is the bottom line that counts most in business. We don't have analyst forecasts, but shareholders might want to examine this detailed historical graph of earnings, revenue and cash flow.
Has MedMira Inc. Been A Good Investment?
With a three year total loss of 33%, MedMira Inc. would certainly have some dissatisfied shareholders. It therefore might be upsetting for shareholders if the CEO were paid generously.
In Summary...
Remuneration for Hermes Chan is close enough to the median pay for a CEO of a similar sized company .
We'd say the company can boast of its EPS growth, but it's disappointing to see negative shareholder returns over three years. Considering the improvement in earnings per share, one could argue that the CEO pay is appropriate, albeit not too low. On another note, MedMira has 4 warning signs (and 3 which shouldn't be ignored) we think you should know about.
Of course, you might find a fantastic investment by looking elsewhere. So take a peek at this free list of interesting companies.
If you spot an error that warrants correction, please contact the editor at editorial-team@simplywallst.com. This article by Simply Wall St is general in nature. It does not constitute a recommendation to buy or sell any stock, and does not take account of your objectives, or your financial situation. Simply Wall St has no position in the stocks mentioned.
We aim to bring you long-term focused research analysis driven by fundamental data. Note that our analysis may not factor in the latest price-sensitive company announcements or qualitative material. Thank you for reading.
