
 Yahoo Finance
 How Does Martin Marietta Materials's (NYSE:MLM) P/E Compare To Its Industry, After The Share Price Drop?

To the annoyance of some shareholders, Martin Marietta Materials (NYSE:MLM) shares are down a considerable 36% in the last month. The recent drop has obliterated the annual return, with the share price now down 18% over that longer period.
Assuming nothing else has changed, a lower share price makes a stock more attractive to potential buyers. In the long term, share prices tend to follow earnings per share, but in the short term prices bounce around in response to short term factors (which are not always obvious). The implication here is that long term investors have an opportunity when expectations of a company are too low. One way to gauge market expectations of a stock is to look at its Price to Earnings Ratio (PE Ratio). A high P/E ratio means that investors have a high expectation about future growth, while a low P/E ratio means they have low expectations about future growth.
See our latest analysis for Martin Marietta Materials
Does Martin Marietta Materials Have A Relatively High Or Low P/E For Its Industry?
Martin Marietta Materials's P/E is 16.41. The image below shows that Martin Marietta Materials has a P/E ratio that is roughly in line with the basic materials industry average (15.5).
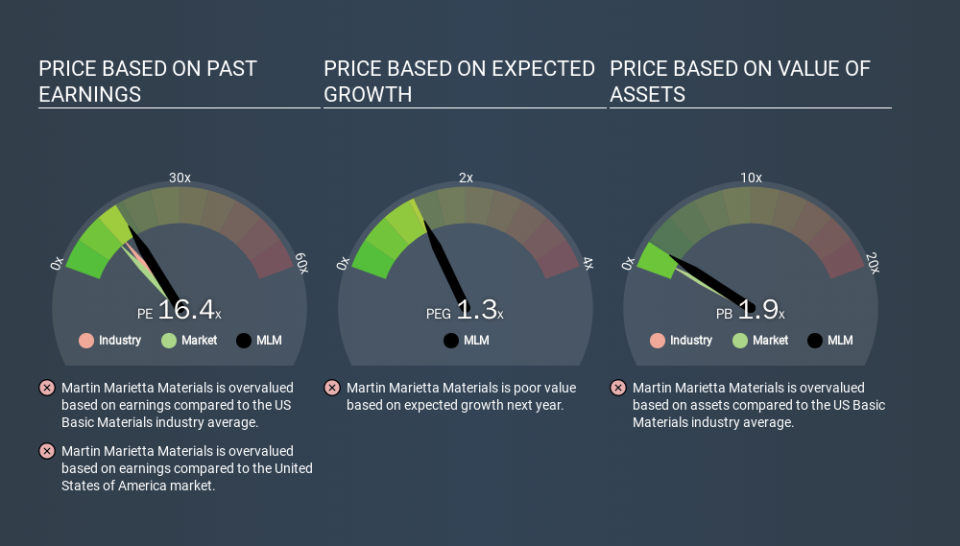
Martin Marietta Materials's P/E tells us that market participants think its prospects are roughly in line with its industry. So if Martin Marietta Materials actually outperforms its peers going forward, that should be a positive for the share price. I would further inform my view by checking insider buying and selling., among other things.
How Growth Rates Impact P/E Ratios
P/E ratios primarily reflect market expectations around earnings growth rates. When earnings grow, the 'E' increases, over time. Therefore, even if you pay a high multiple of earnings now, that multiple will become lower in the future. So while a stock may look expensive based on past earnings, it could be cheap based on future earnings.
Notably, Martin Marietta Materials grew EPS by a whopping 31% in the last year. And it has bolstered its earnings per share by 29% per year over the last five years. So we'd generally expect it to have a relatively high P/E ratio.
A Limitation: P/E Ratios Ignore Debt and Cash In The Bank
One drawback of using a P/E ratio is that it considers market capitalization, but not the balance sheet. That means it doesn't take debt or cash into account. The exact same company would hypothetically deserve a higher P/E ratio if it had a strong balance sheet, than if it had a weak one with lots of debt, because a cashed up company can spend on growth.
While growth expenditure doesn't always pay off, the point is that it is a good option to have; but one that the P/E ratio ignores.
How Does Martin Marietta Materials's Debt Impact Its P/E Ratio?
Martin Marietta Materials's net debt equates to 28% of its market capitalization. You'd want to be aware of this fact, but it doesn't bother us.
The Bottom Line On Martin Marietta Materials's P/E Ratio
Martin Marietta Materials has a P/E of 16.4. That's higher than the average in its market, which is 12.4. While the company does use modest debt, its recent earnings growth is superb. So to be frank we are not surprised it has a high P/E ratio. Given Martin Marietta Materials's P/E ratio has declined from 25.5 to 16.4 in the last month, we know for sure that the market is significantly less confident about the business today, than it was back then. For those who prefer to invest with the flow of momentum, that might be a bad sign, but for a contrarian, it may signal opportunity.
Investors should be looking to buy stocks that the market is wrong about. As value investor Benjamin Graham famously said, 'In the short run, the market is a voting machine but in the long run, it is a weighing machine. So this free visual report on analyst forecasts could hold the key to an excellent investment decision.
Of course you might be able to find a better stock than Martin Marietta Materials. So you may wish to see this free collection of other companies that have grown earnings strongly.
If you spot an error that warrants correction, please contact the editor at editorial-team@simplywallst.com. This article by Simply Wall St is general in nature. It does not constitute a recommendation to buy or sell any stock, and does not take account of your objectives, or your financial situation. Simply Wall St has no position in the stocks mentioned.
We aim to bring you long-term focused research analysis driven by fundamental data. Note that our analysis may not factor in the latest price-sensitive company announcements or qualitative material. Thank you for reading.