
 Yahoo Finance
 How Does LyondellBasell Industries's (NYSE:LYB) P/E Compare To Its Industry, After The Share Price Drop?

To the annoyance of some shareholders, LyondellBasell Industries (NYSE:LYB) shares are down a considerable 31% in the last month. Indeed the recent decline has arguably caused some bitterness for shareholders who have held through the 41% drop over twelve months.
All else being equal, a share price drop should make a stock more attractive to potential investors. In the long term, share prices tend to follow earnings per share, but in the short term prices bounce around in response to short term factors (which are not always obvious). So, on certain occasions, long term focussed investors try to take advantage of pessimistic expectations to buy shares at a better price. One way to gauge market expectations of a stock is to look at its Price to Earnings Ratio (PE Ratio). A high P/E ratio means that investors have a high expectation about future growth, while a low P/E ratio means they have low expectations about future growth.
See our latest analysis for LyondellBasell Industries
How Does LyondellBasell Industries's P/E Ratio Compare To Its Peers?
LyondellBasell Industries's P/E of 5.14 indicates relatively low sentiment towards the stock. The image below shows that LyondellBasell Industries has a lower P/E than the average (15.0) P/E for companies in the chemicals industry.
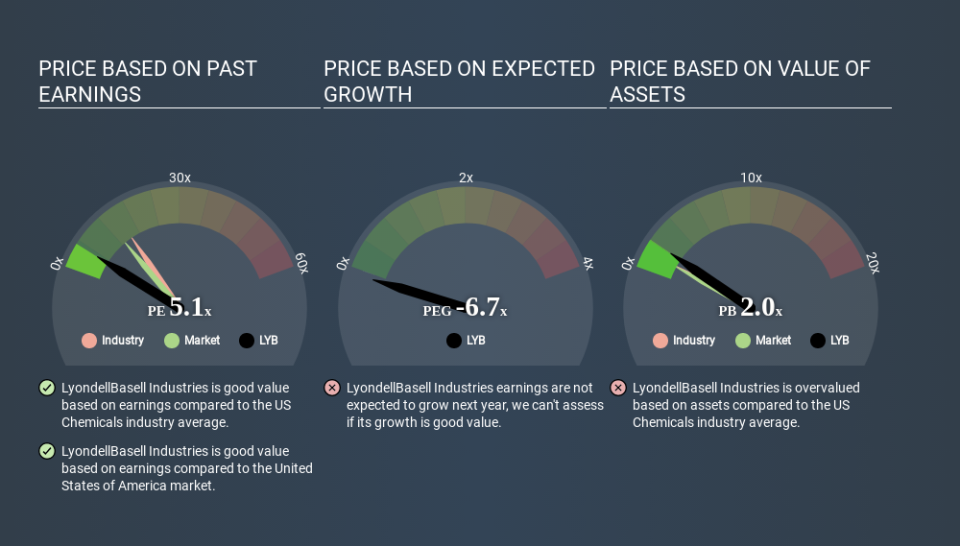
This suggests that market participants think LyondellBasell Industries will underperform other companies in its industry. Since the market seems unimpressed with LyondellBasell Industries, it's quite possible it could surprise on the upside. If you consider the stock interesting, further research is recommended. For example, I often monitor director buying and selling.
How Growth Rates Impact P/E Ratios
Generally speaking the rate of earnings growth has a profound impact on a company's P/E multiple. That's because companies that grow earnings per share quickly will rapidly increase the 'E' in the equation. That means unless the share price increases, the P/E will reduce in a few years. A lower P/E should indicate the stock is cheap relative to others -- and that may attract buyers.
LyondellBasell Industries shrunk earnings per share by 20% over the last year. But it has grown its earnings per share by 3.6% per year over the last five years.
Don't Forget: The P/E Does Not Account For Debt or Bank Deposits
The 'Price' in P/E reflects the market capitalization of the company. So it won't reflect the advantage of cash, or disadvantage of debt. Hypothetically, a company could reduce its future P/E ratio by spending its cash (or taking on debt) to achieve higher earnings.
Such expenditure might be good or bad, in the long term, but the point here is that the balance sheet is not reflected by this ratio.
How Does LyondellBasell Industries's Debt Impact Its P/E Ratio?
LyondellBasell Industries's net debt is 67% of its market cap. If you want to compare its P/E ratio to other companies, you should absolutely keep in mind it has significant borrowings.
The Bottom Line On LyondellBasell Industries's P/E Ratio
LyondellBasell Industries's P/E is 5.1 which is below average (13.0) in the US market. The P/E reflects market pessimism that probably arises from the lack of recent EPS growth, paired with significant leverage. What can be absolutely certain is that the market has become more pessimistic about LyondellBasell Industries over the last month, with the P/E ratio falling from 7.4 back then to 5.1 today. For those who prefer to invest with the flow of momentum, that might be a bad sign, but for deep value investors this stock might justify some research.
Investors should be looking to buy stocks that the market is wrong about. If it is underestimating a company, investors can make money by buying and holding the shares until the market corrects itself. So this free visualization of the analyst consensus on future earnings could help you make the right decision about whether to buy, sell, or hold.
Of course, you might find a fantastic investment by looking at a few good candidates. So take a peek at this free list of companies with modest (or no) debt, trading on a P/E below 20.
If you spot an error that warrants correction, please contact the editor at editorial-team@simplywallst.com. This article by Simply Wall St is general in nature. It does not constitute a recommendation to buy or sell any stock, and does not take account of your objectives, or your financial situation. Simply Wall St has no position in the stocks mentioned.
We aim to bring you long-term focused research analysis driven by fundamental data. Note that our analysis may not factor in the latest price-sensitive company announcements or qualitative material. Thank you for reading.
