
 Yahoo Finance
 What does Kidman Resources Limited’s (ASX:KDR) Balance Sheet Tell Us About Its Future?

Investors are always looking for growth in small-cap stocks like Kidman Resources Limited (ASX:KDR), with a market cap of AU$485.0m. However, an important fact which most ignore is: how financially healthy is the business? Since KDR is loss-making right now, it’s vital to evaluate the current state of its operations and pathway to profitability. Here are a few basic checks that are good enough to have a broad overview of the company’s financial strength. Nevertheless, given that I have not delve into the company-specifics, I recommend you dig deeper yourself into KDR here.
How much cash does KDR generate through its operations?
Over the past year, KDR has reduced its debt from AU$7.2m to AU$6.4m . With this debt repayment, KDR’s cash and short-term investments stands at AU$5.4m , ready to deploy into the business. Moving onto cash from operations, its operating cash flow is not yet significant enough to calculate a meaningful cash-to-debt ratio, indicating that operational efficiency is something we’d need to take a look at. As the purpose of this article is a high-level overview, I won’t be looking at this today, but you can examine some of KDR’s operating efficiency ratios such as ROA here.
Can KDR pay its short-term liabilities?
With current liabilities at AU$9.5m, it seems that the business has not maintained a sufficient level of current assets to meet its obligations, with the current ratio last standing at 0.81x, which is below the prudent industry ratio of 3x.
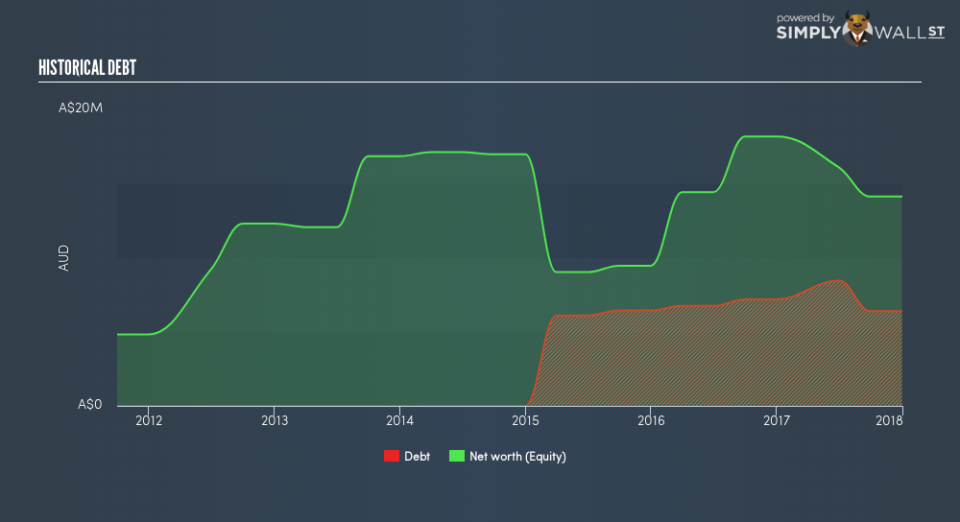
Can KDR service its debt comfortably?
With debt reaching 45.3% of equity, KDR may be thought of as relatively highly levered. This is not unusual for small-caps as debt tends to be a cheaper and faster source of funding for some businesses. However, since KDR is presently unprofitable, sustainability of its current state of operations becomes a concern. Maintaining a high level of debt, while revenues are still below costs, can be dangerous as liquidity tends to dry up in unexpected downturns.
Next Steps:
KDR’s cash flow coverage indicates it could improve its operating efficiency in order to meet demand for debt repayments should unforeseen events arise. In addition to this, its lack of liquidity raises questions over current asset management practices for the small-cap. I admit this is a fairly basic analysis for KDR’s financial health. Other important fundamentals need to be considered alongside. I suggest you continue to research Kidman Resources to get a better picture of the stock by looking at:
Future Outlook: What are well-informed industry analysts predicting for KDR’s future growth? Take a look at our free research report of analyst consensus for KDR’s outlook.
Historical Performance: What has KDR’s returns been like over the past? Go into more detail in the past track record analysis and take a look at the free visual representations of our analysis for more clarity.
Other High-Performing Stocks: Are there other stocks that provide better prospects with proven track records? Explore our free list of these great stocks here.
To help readers see past the short term volatility of the financial market, we aim to bring you a long-term focused research analysis purely driven by fundamental data. Note that our analysis does not factor in the latest price-sensitive company announcements.
The author is an independent contributor and at the time of publication had no position in the stocks mentioned. For errors that warrant correction please contact the editor at editorial-team@simplywallst.com.
