
 Yahoo Finance
 How Does Kelt Exploration's (TSE:KEL) P/E Compare To Its Industry, After The Share Price Drop?
To the annoyance of some shareholders, Kelt Exploration (TSE:KEL) shares are down a considerable 77% in the last month. Given the 84% drop over the last year, some shareholders might be worried that they have become bagholders. For those wondering, a bagholder is someone who keeps holding a losing stock indefinitely, without taking the time to consider its prospects carefully, going forward.
All else being equal, a share price drop should make a stock more attractive to potential investors. While the market sentiment towards a stock is very changeable, in the long run, the share price will tend to move in the same direction as earnings per share. So, on certain occasions, long term focussed investors try to take advantage of pessimistic expectations to buy shares at a better price. One way to gauge market expectations of a stock is to look at its Price to Earnings Ratio (PE Ratio). A high P/E implies that investors have high expectations of what a company can achieve compared to a company with a low P/E ratio.
Check out our latest analysis for Kelt Exploration
Does Kelt Exploration Have A Relatively High Or Low P/E For Its Industry?
Kelt Exploration's P/E of 25.24 indicates some degree of optimism towards the stock. You can see in the image below that the average P/E (5.8) for companies in the oil and gas industry is a lot lower than Kelt Exploration's P/E.
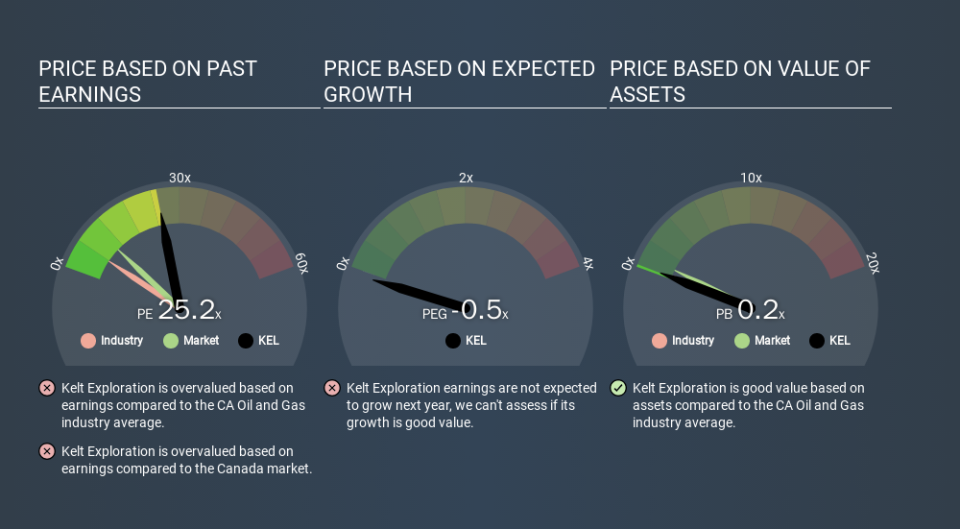
Its relatively high P/E ratio indicates that Kelt Exploration shareholders think it will perform better than other companies in its industry classification. Clearly the market expects growth, but it isn't guaranteed. So investors should always consider the P/E ratio alongside other factors, such as whether company directors have been buying shares.
How Growth Rates Impact P/E Ratios
Probably the most important factor in determining what P/E a company trades on is the earnings growth. If earnings are growing quickly, then the 'E' in the equation will increase faster than it would otherwise. Therefore, even if you pay a high multiple of earnings now, that multiple will become lower in the future. A lower P/E should indicate the stock is cheap relative to others -- and that may attract buyers.
Kelt Exploration's earnings per share fell by 20% in the last twelve months. And it has shrunk its earnings per share by 16% per year over the last five years. This growth rate might warrant a below average P/E ratio.
A Limitation: P/E Ratios Ignore Debt and Cash In The Bank
One drawback of using a P/E ratio is that it considers market capitalization, but not the balance sheet. So it won't reflect the advantage of cash, or disadvantage of debt. In theory, a company can lower its future P/E ratio by using cash or debt to invest in growth.
While growth expenditure doesn't always pay off, the point is that it is a good option to have; but one that the P/E ratio ignores.
Kelt Exploration's Balance Sheet
Net debt totals a substantial 222% of Kelt Exploration's market cap. If you want to compare its P/E ratio to other companies, you must keep in mind that these debt levels would usually warrant a relatively low P/E.
The Bottom Line On Kelt Exploration's P/E Ratio
Kelt Exploration trades on a P/E ratio of 25.2, which is above its market average of 10.1. With meaningful debt and a lack of recent earnings growth, the market has high expectations that the business will earn more in the future. What can be absolutely certain is that the market has become significantly less optimistic about Kelt Exploration over the last month, with the P/E ratio falling from 108.5 back then to 25.2 today. For those who prefer to invest with the flow of momentum, that might be a bad sign, but for a contrarian, it may signal opportunity.
Investors have an opportunity when market expectations about a stock are wrong. As value investor Benjamin Graham famously said, 'In the short run, the market is a voting machine but in the long run, it is a weighing machine. So this free report on the analyst consensus forecasts could help you make a master move on this stock.
Of course, you might find a fantastic investment by looking at a few good candidates. So take a peek at this free list of companies with modest (or no) debt, trading on a P/E below 20.
If you spot an error that warrants correction, please contact the editor at editorial-team@simplywallst.com. This article by Simply Wall St is general in nature. It does not constitute a recommendation to buy or sell any stock, and does not take account of your objectives, or your financial situation. Simply Wall St has no position in the stocks mentioned.
We aim to bring you long-term focused research analysis driven by fundamental data. Note that our analysis may not factor in the latest price-sensitive company announcements or qualitative material. Thank you for reading.
