
 Yahoo Finance
 What Does Jinchuan Group International Resources Co. Ltd's (HKG:2362) P/E Ratio Tell You?

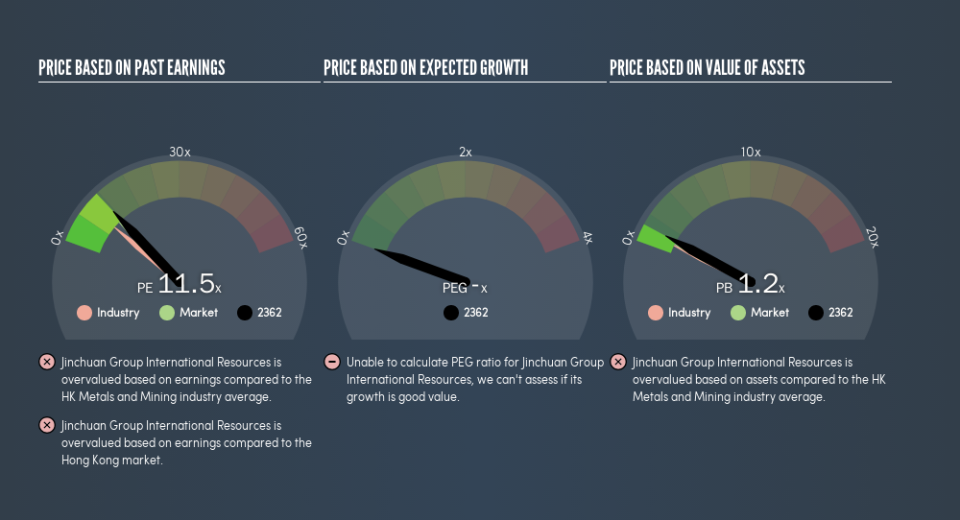
This article is written for those who want to get better at using price to earnings ratios (P/E ratios). To keep it practical, we'll show how Jinchuan Group International Resources Co. Ltd's (HKG:2362) P/E ratio could help you assess the value on offer. Based on the last twelve months, Jinchuan Group International Resources's P/E ratio is 11.55. That is equivalent to an earnings yield of about 8.7%.
See our latest analysis for Jinchuan Group International Resources
How Do I Calculate A Price To Earnings Ratio?
The formula for price to earnings is:
Price to Earnings Ratio = Price per Share (in the reporting currency) ÷ Earnings per Share (EPS)
Or for Jinchuan Group International Resources:
P/E of 11.55 = $0.083 (Note: this is the share price in the reporting currency, namely, USD ) ÷ $0.0072 (Based on the year to December 2018.)
Is A High Price-to-Earnings Ratio Good?
A higher P/E ratio means that investors are paying a higher price for each HK$1 of company earnings. That is not a good or a bad thing per se, but a high P/E does imply buyers are optimistic about the future.
How Does Jinchuan Group International Resources's P/E Ratio Compare To Its Peers?
The P/E ratio essentially measures market expectations of a company. You can see in the image below that the average P/E (8.6) for companies in the metals and mining industry is lower than Jinchuan Group International Resources's P/E.
Its relatively high P/E ratio indicates that Jinchuan Group International Resources shareholders think it will perform better than other companies in its industry classification. Shareholders are clearly optimistic, but the future is always uncertain. So further research is always essential. I often monitor director buying and selling.
How Growth Rates Impact P/E Ratios
P/E ratios primarily reflect market expectations around earnings growth rates. If earnings are growing quickly, then the 'E' in the equation will increase faster than it would otherwise. And in that case, the P/E ratio itself will drop rather quickly. And as that P/E ratio drops, the company will look cheap, unless its share price increases.
Jinchuan Group International Resources shrunk earnings per share by 19% over the last year. And EPS is down 31% a year, over the last 5 years. This could justify a pessimistic P/E.
A Limitation: P/E Ratios Ignore Debt and Cash In The Bank
The 'Price' in P/E reflects the market capitalization of the company. Thus, the metric does not reflect cash or debt held by the company. The exact same company would hypothetically deserve a higher P/E ratio if it had a strong balance sheet, than if it had a weak one with lots of debt, because a cashed up company can spend on growth.
Spending on growth might be good or bad a few years later, but the point is that the P/E ratio does not account for the option (or lack thereof).
So What Does Jinchuan Group International Resources's Balance Sheet Tell Us?
Jinchuan Group International Resources's net debt equates to 33% of its market capitalization. While it's worth keeping this in mind, it isn't a worry.
The Bottom Line On Jinchuan Group International Resources's P/E Ratio
Jinchuan Group International Resources has a P/E of 11.5. That's higher than the average in its market, which is 10.6. With modest debt but no EPS growth in the last year, it's fair to say the P/E implies some optimism about future earnings, from the market.
When the market is wrong about a stock, it gives savvy investors an opportunity. People often underestimate remarkable growth -- so investors can make money when fast growth is not fully appreciated. We don't have analyst forecasts, but you could get a better understanding of its growth by checking out this more detailed historical graph of earnings, revenue and cash flow.
You might be able to find a better buy than Jinchuan Group International Resources. If you want a selection of possible winners, check out this free list of interesting companies that trade on a P/E below 20 (but have proven they can grow earnings).
We aim to bring you long-term focused research analysis driven by fundamental data. Note that our analysis may not factor in the latest price-sensitive company announcements or qualitative material.
If you spot an error that warrants correction, please contact the editor at editorial-team@simplywallst.com. This article by Simply Wall St is general in nature. It does not constitute a recommendation to buy or sell any stock, and does not take account of your objectives, or your financial situation. Simply Wall St has no position in the stocks mentioned. Thank you for reading.
