
 Yahoo Finance
 How Does Imperial Oil's (TSE:IMO) P/E Compare To Its Industry, After Its Big Share Price Gain?

Imperial Oil (TSE:IMO) shareholders are no doubt pleased to see that the share price has bounced 53% in the last month alone, although it is still down 29% over the last quarter. But shareholders may not all be feeling jubilant, since the share price is still down 41% in the last year.
All else being equal, a sharp share price increase should make a stock less attractive to potential investors. While the market sentiment towards a stock is very changeable, in the long run, the share price will tend to move in the same direction as earnings per share. The implication here is that deep value investors might steer clear when expectations of a company are too high. One way to gauge market expectations of a stock is to look at its Price to Earnings Ratio (PE Ratio). A high P/E implies that investors have high expectations of what a company can achieve compared to a company with a low P/E ratio.
Check out our latest analysis for Imperial Oil
How Does Imperial Oil's P/E Ratio Compare To Its Peers?
Imperial Oil's P/E of 7.86 indicates some degree of optimism towards the stock. You can see in the image below that the average P/E (6.8) for companies in the oil and gas industry is lower than Imperial Oil's P/E.
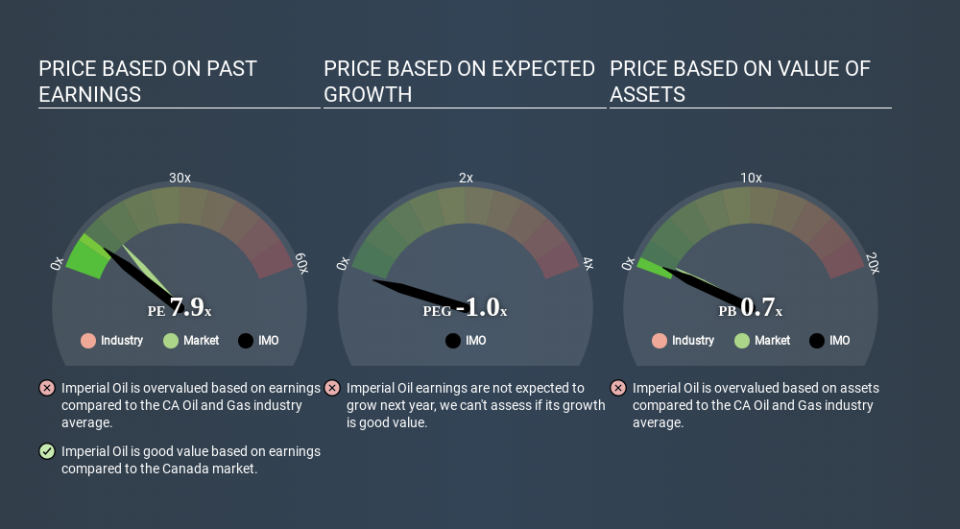
Imperial Oil's P/E tells us that market participants think the company will perform better than its industry peers, going forward. Shareholders are clearly optimistic, but the future is always uncertain. So investors should always consider the P/E ratio alongside other factors, such as whether company directors have been buying shares.
How Growth Rates Impact P/E Ratios
Probably the most important factor in determining what P/E a company trades on is the earnings growth. Earnings growth means that in the future the 'E' will be higher. And in that case, the P/E ratio itself will drop rather quickly. So while a stock may look expensive based on past earnings, it could be cheap based on future earnings.
Imperial Oil maintained roughly steady earnings over the last twelve months. But it has grown its earnings per share by 4.1% per year over the last three years. And it has shrunk its earnings per share by 8.4% per year over the last five years. So we might expect a relatively low P/E.
A Limitation: P/E Ratios Ignore Debt and Cash In The Bank
It's important to note that the P/E ratio considers the market capitalization, not the enterprise value. Thus, the metric does not reflect cash or debt held by the company. Theoretically, a business can improve its earnings (and produce a lower P/E in the future) by investing in growth. That means taking on debt (or spending its cash).
Such spending might be good or bad, overall, but the key point here is that you need to look at debt to understand the P/E ratio in context.
How Does Imperial Oil's Debt Impact Its P/E Ratio?
Imperial Oil's net debt is 20% of its market cap. That's enough debt to impact the P/E ratio a little; so keep it in mind if you're comparing it to companies without debt.
The Verdict On Imperial Oil's P/E Ratio
Imperial Oil has a P/E of 7.9. That's below the average in the CA market, which is 12.3. EPS grew over the last twelve months, and debt levels are quite reasonable. If growth is sustainable over the long term, then the current P/E ratio may be a sign of good value. What is very clear is that the market has become less pessimistic about Imperial Oil over the last month, with the P/E ratio rising from 5.2 back then to 7.9 today. For those who like to invest in turnarounds, that might mean it's time to put the stock on a watchlist, or research it. But others might consider the opportunity to have passed.
When the market is wrong about a stock, it gives savvy investors an opportunity. As value investor Benjamin Graham famously said, 'In the short run, the market is a voting machine but in the long run, it is a weighing machine. So this free visual report on analyst forecasts could hold the key to an excellent investment decision.
Of course, you might find a fantastic investment by looking at a few good candidates. So take a peek at this free list of companies with modest (or no) debt, trading on a P/E below 20.
If you spot an error that warrants correction, please contact the editor at editorial-team@simplywallst.com. This article by Simply Wall St is general in nature. It does not constitute a recommendation to buy or sell any stock, and does not take account of your objectives, or your financial situation. Simply Wall St has no position in the stocks mentioned.
We aim to bring you long-term focused research analysis driven by fundamental data. Note that our analysis may not factor in the latest price-sensitive company announcements or qualitative material. Thank you for reading.
