
 Yahoo Finance
 Does HTC Purenergy Inc.'s (CVE:HTC) CEO Salary Reflect Performance?

The CEO of HTC Purenergy Inc. (CVE:HTC) is Lionel Kambeitz. First, this article will compare CEO compensation with compensation at similar sized companies. Next, we'll consider growth that the business demonstrates. And finally - as a second measure of performance - we will look at the returns shareholders have received over the last few years. This method should give us information to assess how appropriately the company pays the CEO.
View our latest analysis for HTC Purenergy
How Does Lionel Kambeitz's Compensation Compare With Similar Sized Companies?
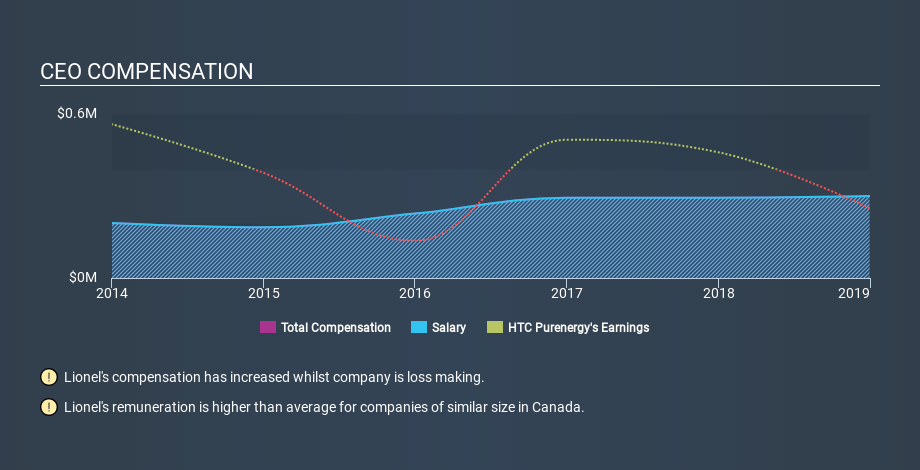
At the time of writing, our data says that HTC Purenergy Inc. has a market cap of CA$23m, and reported total annual CEO compensation of CA$300k for the year to December 2018. It is worth noting that the CEO compensation consists almost entirely of the salary, worth CA$300k. We looked at a group of companies with market capitalizations under CA$261m, and the median CEO total compensation was CA$211k.
It would therefore appear that HTC Purenergy Inc. pays Lionel Kambeitz more than the median CEO remuneration at companies of a similar size, in the same market. However, this fact alone doesn't mean the remuneration is too high. We can better assess whether the pay is overly generous by looking into the underlying business performance.
You can see a visual representation of the CEO compensation at HTC Purenergy, below.
Is HTC Purenergy Inc. Growing?
On average over the last three years, HTC Purenergy Inc. has shrunk earnings per share by 67% each year (measured with a line of best fit). In the last year, its revenue is up 127%.
Investors should note that, over three years, earnings per share are down. But in contrast the revenue growth is strong, suggesting future potential for earnings growth. It's hard to reach a conclusion about business performance right now. This may be one to watch. We don't have analyst forecasts, but you might want to assess this data-rich visualization of earnings, revenue and cash flow.
Has HTC Purenergy Inc. Been A Good Investment?
Since shareholders would have lost about 10.0% over three years, some HTC Purenergy Inc. shareholders would surely be feeling negative emotions. It therefore might be upsetting for shareholders if the CEO were paid generously.
In Summary...
We compared the total CEO remuneration paid by HTC Purenergy Inc., and compared it to remuneration at a group of similar sized companies. As discussed above, we discovered that the company pays more than the median of that group.
Over the last three years, shareholder returns have been downright disappointing, and the underlying business has failed to impress us. Shareholders may wish to consider further research. Although we don't think the CEO pay is too high, it is probably more on the generous side of things. If you think CEO compensation levels are interesting you will probably really like this free visualization of insider trading at HTC Purenergy.
Arguably, business quality is much more important than CEO compensation levels. So check out this free list of interesting companies, that have HIGH return on equity and low debt.
If you spot an error that warrants correction, please contact the editor at editorial-team@simplywallst.com. This article by Simply Wall St is general in nature. It does not constitute a recommendation to buy or sell any stock, and does not take account of your objectives, or your financial situation. Simply Wall St has no position in the stocks mentioned.
We aim to bring you long-term focused research analysis driven by fundamental data. Note that our analysis may not factor in the latest price-sensitive company announcements or qualitative material. Thank you for reading.
