
 Yahoo Finance
 What Does The Howard Hughes Corporation’s (NYSE:HHC) P/E Ratio Tell You?

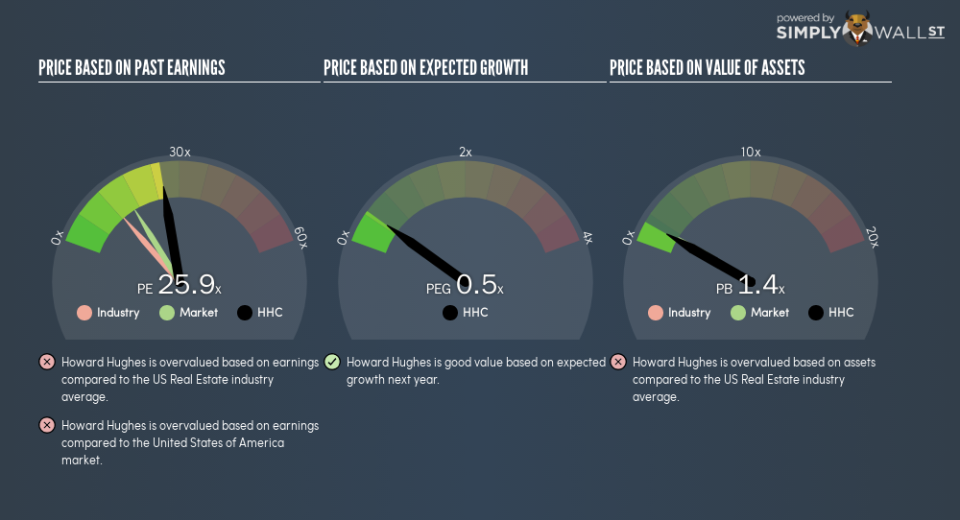
The goal of this article is to teach you how to use price to earnings ratios (P/E ratios). We’ll show how you can use The Howard Hughes Corporation’s (NYSE:HHC) P/E ratio to inform your assessment of the investment opportunity. Howard Hughes has a price to earnings ratio of 25.92, based on the last twelve months. That means that at current prices, buyers pay $25.92 for every $1 in trailing yearly profits.
View our latest analysis for Howard Hughes
How Do You Calculate A P/E Ratio?
The formula for P/E is:
Price to Earnings Ratio = Share Price ÷ Earnings per Share (EPS)
Or for Howard Hughes:
P/E of 25.92 = $101.82 ÷ $3.93 (Based on the year to September 2018.)
Is A High P/E Ratio Good?
A higher P/E ratio means that investors are paying a higher price for each $1 of company earnings. That isn’t necessarily good or bad, but a high P/E implies relatively high expectations of what a company can achieve in the future.
How Growth Rates Impact P/E Ratios
Companies that shrink earnings per share quickly will rapidly decrease the ‘E’ in the equation. Therefore, even if you pay a low multiple of earnings now, that multiple will become higher in the future. A higher P/E should indicate the stock is expensive relative to others — and that may encourage shareholders to sell.
Notably, Howard Hughes grew EPS by a whopping 153% in the last year. And earnings per share have improved by 44% annually, over the last five years. So we’d generally expect it to have a relatively high P/E ratio. But earnings per share are down 21% per year over the last three years.
How Does Howard Hughes’s P/E Ratio Compare To Its Peers?
The P/E ratio essentially measures market expectations of a company. The image below shows that Howard Hughes has a higher P/E than the average (12.6) P/E for companies in the real estate industry.
Howard Hughes’s P/E tells us that market participants think the company will perform better than its industry peers, going forward. Clearly the market expects growth, but it isn’t guaranteed. So further research is always essential. I often monitor director buying and selling.
Don’t Forget: The P/E Does Not Account For Debt or Bank Deposits
Don’t forget that the P/E ratio considers market capitalization. That means it doesn’t take debt or cash into account. Hypothetically, a company could reduce its future P/E ratio by spending its cash (or taking on debt) to achieve higher earnings.
Such expenditure might be good or bad, in the long term, but the point here is that the balance sheet is not reflected by this ratio.
How Does Howard Hughes’s Debt Impact Its P/E Ratio?
Net debt totals 66% of Howard Hughes’s market cap. This is enough debt that you’d have to make some adjustments before using the P/E ratio to compare it to a company with net cash.
The Verdict On Howard Hughes’s P/E Ratio
Howard Hughes’s P/E is 25.9 which is above average (16.5) in the US market. It has already proven it can grow earnings, but the debt levels mean it faces some risks. It seems the market believes growth will continue, judging by the P/E ratio.
Investors should be looking to buy stocks that the market is wrong about. As value investor Benjamin Graham famously said, ‘In the short run, the market is a voting machine but in the long run, it is a weighing machine.’ So this free visual report on analyst forecasts could hold they key to an excellent investment decision.
Of course, you might find a fantastic investment by looking at a few good candidates. So take a peek at this free list of companies with modest (or no) debt, trading on a P/E below 20.
To help readers see past the short term volatility of the financial market, we aim to bring you a long-term focused research analysis purely driven by fundamental data. Note that our analysis does not factor in the latest price-sensitive company announcements.
The author is an independent contributor and at the time of publication had no position in the stocks mentioned. For errors that warrant correction please contact the editor at editorial-team@simplywallst.com.
