
 Yahoo Finance
 What Does The Home Depot, Inc.'s (NYSE:HD) P/E Ratio Tell You?

Want to participate in a short research study? Help shape the future of investing tools and you could win a $250 gift card!
This article is written for those who want to get better at using price to earnings ratios (P/E ratios). We'll look at The Home Depot, Inc.'s (NYSE:HD) P/E ratio and reflect on what it tells us about the company's share price. Home Depot has a P/E ratio of 19.02, based on the last twelve months. That corresponds to an earnings yield of approximately 5.3%.
View our latest analysis for Home Depot
How Do You Calculate Home Depot's P/E Ratio?
The formula for price to earnings is:
Price to Earnings Ratio = Share Price ÷ Earnings per Share (EPS)
Or for Home Depot:
P/E of 19.02 = $189.99 ÷ $9.99 (Based on the year to May 2019.)
Is A High Price-to-Earnings Ratio Good?
A higher P/E ratio means that investors are paying a higher price for each $1 of company earnings. That is not a good or a bad thing per se, but a high P/E does imply buyers are optimistic about the future.
How Growth Rates Impact P/E Ratios
Probably the most important factor in determining what P/E a company trades on is the earnings growth. If earnings are growing quickly, then the 'E' in the equation will increase faster than it would otherwise. That means even if the current P/E is high, it will reduce over time if the share price stays flat. A lower P/E should indicate the stock is cheap relative to others -- and that may attract buyers.
Notably, Home Depot grew EPS by a whopping 28% in the last year. And its annual EPS growth rate over 5 years is 20%. With that performance, I would expect it to have an above average P/E ratio.
Does Home Depot Have A Relatively High Or Low P/E For Its Industry?
The P/E ratio indicates whether the market has higher or lower expectations of a company. As you can see below, Home Depot has a higher P/E than the average company (15.8) in the specialty retail industry.
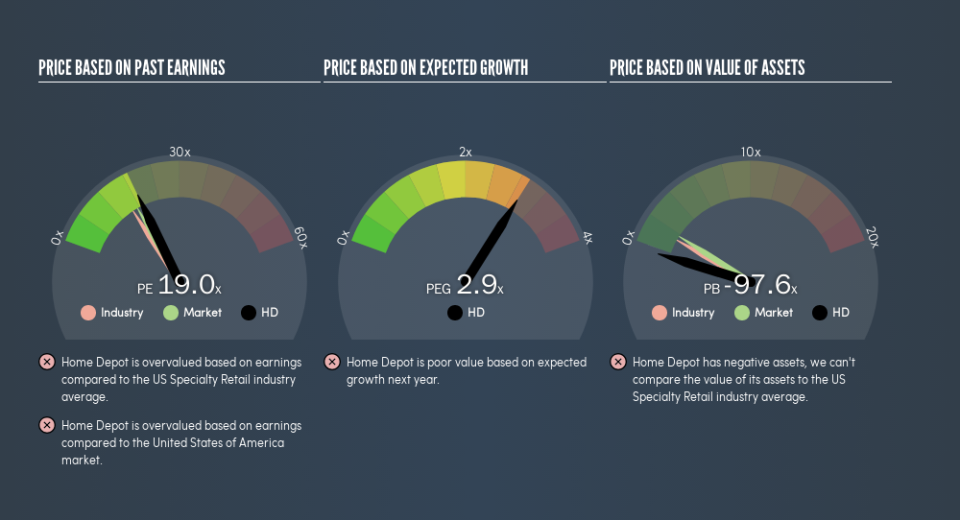
Its relatively high P/E ratio indicates that Home Depot shareholders think it will perform better than other companies in its industry classification. Clearly the market expects growth, but it isn't guaranteed. So investors should delve deeper. I like to check if company insiders have been buying or selling.
Remember: P/E Ratios Don't Consider The Balance Sheet
One drawback of using a P/E ratio is that it considers market capitalization, but not the balance sheet. So it won't reflect the advantage of cash, or disadvantage of debt. Theoretically, a business can improve its earnings (and produce a lower P/E in the future) by investing in growth. That means taking on debt (or spending its cash).
Such spending might be good or bad, overall, but the key point here is that you need to look at debt to understand the P/E ratio in context.
How Does Home Depot's Debt Impact Its P/E Ratio?
Home Depot's net debt is 15% of its market cap. This could bring some additional risk, and reduce the number of investment options for management; worth remembering if you compare its P/E to businesses without debt.
The Bottom Line On Home Depot's P/E Ratio
Home Depot trades on a P/E ratio of 19, which is above the US market average of 17.3. Its debt levels do not imperil its balance sheet and it is growing EPS strongly. So on this analysis it seems reasonable that its P/E ratio is above average.
When the market is wrong about a stock, it gives savvy investors an opportunity. People often underestimate remarkable growth -- so investors can make money when fast growth is not fully appreciated. So this free visualization of the analyst consensus on future earnings could help you make the right decision about whether to buy, sell, or hold.
But note: Home Depot may not be the best stock to buy. So take a peek at this free list of interesting companies with strong recent earnings growth (and a P/E ratio below 20).
We aim to bring you long-term focused research analysis driven by fundamental data. Note that our analysis may not factor in the latest price-sensitive company announcements or qualitative material.
If you spot an error that warrants correction, please contact the editor at editorial-team@simplywallst.com. This article by Simply Wall St is general in nature. It does not constitute a recommendation to buy or sell any stock, and does not take account of your objectives, or your financial situation. Simply Wall St has no position in the stocks mentioned. Thank you for reading.
