
 Yahoo Finance
 How Does HollyFrontier's (NYSE:HFC) P/E Compare To Its Industry, After The Share Price Drop?

To the annoyance of some shareholders, HollyFrontier (NYSE:HFC) shares are down a considerable 30% in the last month. Indeed the recent decline has arguably caused some bitterness for shareholders who have held through the 54% drop over twelve months.
Assuming nothing else has changed, a lower share price makes a stock more attractive to potential buyers. In the long term, share prices tend to follow earnings per share, but in the short term prices bounce around in response to short term factors (which are not always obvious). The implication here is that long term investors have an opportunity when expectations of a company are too low. Perhaps the simplest way to get a read on investors' expectations of a business is to look at its Price to Earnings Ratio (PE Ratio). A high P/E ratio means that investors have a high expectation about future growth, while a low P/E ratio means they have low expectations about future growth.
See our latest analysis for HollyFrontier
How Does HollyFrontier's P/E Ratio Compare To Its Peers?
HollyFrontier's P/E of 4.95 indicates relatively low sentiment towards the stock. We can see in the image below that the average P/E (7.0) for companies in the oil and gas industry is higher than HollyFrontier's P/E.
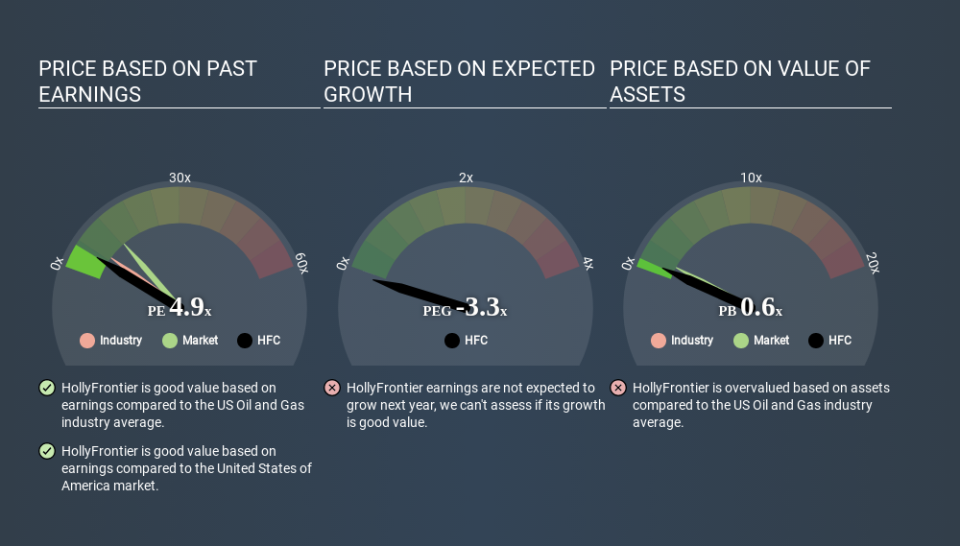
HollyFrontier's P/E tells us that market participants think it will not fare as well as its peers in the same industry. While current expectations are low, the stock could be undervalued if the situation is better than the market assumes. If you consider the stock interesting, further research is recommended. For example, I often monitor director buying and selling.
How Growth Rates Impact P/E Ratios
Generally speaking the rate of earnings growth has a profound impact on a company's P/E multiple. When earnings grow, the 'E' increases, over time. That means even if the current P/E is high, it will reduce over time if the share price stays flat. So while a stock may look expensive based on past earnings, it could be cheap based on future earnings.
HollyFrontier's earnings per share fell by 26% in the last twelve months. But it has grown its earnings per share by 27% per year over the last five years.
Remember: P/E Ratios Don't Consider The Balance Sheet
One drawback of using a P/E ratio is that it considers market capitalization, but not the balance sheet. In other words, it does not consider any debt or cash that the company may have on the balance sheet. In theory, a company can lower its future P/E ratio by using cash or debt to invest in growth.
Such spending might be good or bad, overall, but the key point here is that you need to look at debt to understand the P/E ratio in context.
HollyFrontier's Balance Sheet
Net debt is 43% of HollyFrontier's market cap. You'd want to be aware of this fact, but it doesn't bother us.
The Verdict On HollyFrontier's P/E Ratio
HollyFrontier trades on a P/E ratio of 4.9, which is below the US market average of 12.5. Since it only carries a modest debt load, it's likely the low expectations implied by the P/E ratio arise from the lack of recent earnings growth. What can be absolutely certain is that the market has become more pessimistic about HollyFrontier over the last month, with the P/E ratio falling from 7.1 back then to 4.9 today. For those who prefer to invest with the flow of momentum, that might be a bad sign, but for deep value investors this stock might justify some research.
When the market is wrong about a stock, it gives savvy investors an opportunity. If it is underestimating a company, investors can make money by buying and holding the shares until the market corrects itself. So this free report on the analyst consensus forecasts could help you make a master move on this stock.
You might be able to find a better buy than HollyFrontier. If you want a selection of possible winners, check out this free list of interesting companies that trade on a P/E below 20 (but have proven they can grow earnings).
If you spot an error that warrants correction, please contact the editor at editorial-team@simplywallst.com. This article by Simply Wall St is general in nature. It does not constitute a recommendation to buy or sell any stock, and does not take account of your objectives, or your financial situation. Simply Wall St has no position in the stocks mentioned.
We aim to bring you long-term focused research analysis driven by fundamental data. Note that our analysis may not factor in the latest price-sensitive company announcements or qualitative material. Thank you for reading.
