
 Yahoo Finance
 How Does HollyFrontier's (NYSE:HFC) P/E Compare To Its Industry, After Its Big Share Price Gain?

HollyFrontier (NYSE:HFC) shareholders are no doubt pleased to see that the share price has bounced 39% in the last month alone, although it is still down 42% over the last quarter. But shareholders may not all be feeling jubilant, since the share price is still down 46% in the last year.
Assuming no other changes, a sharply higher share price makes a stock less attractive to potential buyers. While the market sentiment towards a stock is very changeable, in the long run, the share price will tend to move in the same direction as earnings per share. So some would prefer to hold off buying when there is a lot of optimism towards a stock. Perhaps the simplest way to get a read on investors' expectations of a business is to look at its Price to Earnings Ratio (PE Ratio). Investors have optimistic expectations of companies with higher P/E ratios, compared to companies with lower P/E ratios.
Check out our latest analysis for HollyFrontier
How Does HollyFrontier's P/E Ratio Compare To Its Peers?
We can tell from its P/E ratio of 5.79 that sentiment around HollyFrontier isn't particularly high. If you look at the image below, you can see HollyFrontier has a lower P/E than the average (8.1) in the oil and gas industry classification.
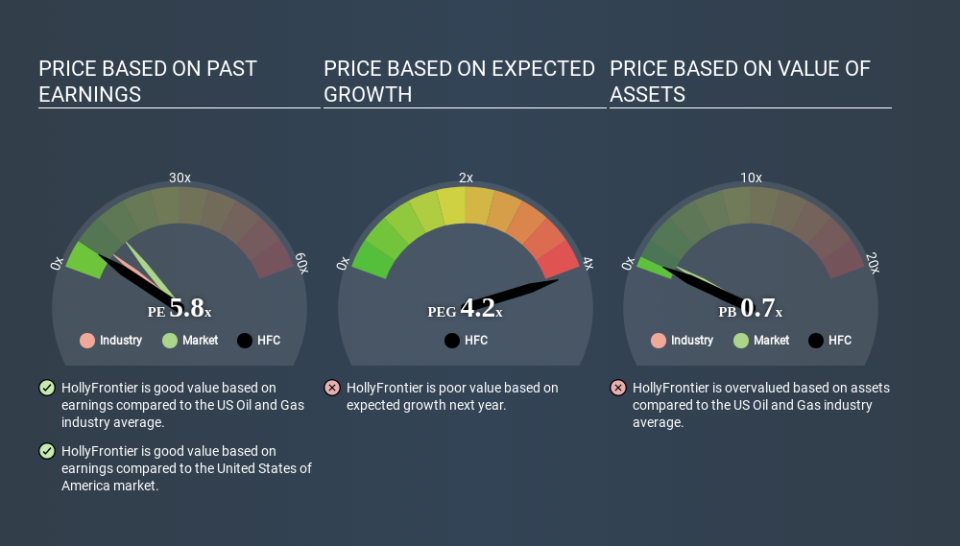
HollyFrontier's P/E tells us that market participants think it will not fare as well as its peers in the same industry. Since the market seems unimpressed with HollyFrontier, it's quite possible it could surprise on the upside. It is arguably worth checking if insiders are buying shares, because that might imply they believe the stock is undervalued.
How Growth Rates Impact P/E Ratios
Generally speaking the rate of earnings growth has a profound impact on a company's P/E multiple. When earnings grow, the 'E' increases, over time. That means unless the share price increases, the P/E will reduce in a few years. A lower P/E should indicate the stock is cheap relative to others -- and that may attract buyers.
HollyFrontier saw earnings per share decrease by 26% last year. But it has grown its earnings per share by 27% per year over the last five years.
Don't Forget: The P/E Does Not Account For Debt or Bank Deposits
The 'Price' in P/E reflects the market capitalization of the company. So it won't reflect the advantage of cash, or disadvantage of debt. Theoretically, a business can improve its earnings (and produce a lower P/E in the future) by investing in growth. That means taking on debt (or spending its cash).
Spending on growth might be good or bad a few years later, but the point is that the P/E ratio does not account for the option (or lack thereof).
HollyFrontier's Balance Sheet
Net debt is 37% of HollyFrontier's market cap. You'd want to be aware of this fact, but it doesn't bother us.
The Bottom Line On HollyFrontier's P/E Ratio
HollyFrontier has a P/E of 5.8. That's below the average in the US market, which is 13.3. Since it only carries a modest debt load, it's likely the low expectations implied by the P/E ratio arise from the lack of recent earnings growth. What is very clear is that the market has become less pessimistic about HollyFrontier over the last month, with the P/E ratio rising from 4.2 back then to 5.8 today. For those who like to invest in turnarounds, that might mean it's time to put the stock on a watchlist, or research it. But others might consider the opportunity to have passed.
When the market is wrong about a stock, it gives savvy investors an opportunity. If the reality for a company is not as bad as the P/E ratio indicates, then the share price should increase as the market realizes this. So this free visual report on analyst forecasts could hold the key to an excellent investment decision.
You might be able to find a better buy than HollyFrontier. If you want a selection of possible winners, check out this free list of interesting companies that trade on a P/E below 20 (but have proven they can grow earnings).
If you spot an error that warrants correction, please contact the editor at editorial-team@simplywallst.com. This article by Simply Wall St is general in nature. It does not constitute a recommendation to buy or sell any stock, and does not take account of your objectives, or your financial situation. Simply Wall St has no position in the stocks mentioned.
We aim to bring you long-term focused research analysis driven by fundamental data. Note that our analysis may not factor in the latest price-sensitive company announcements or qualitative material. Thank you for reading.
