
 Yahoo Finance
 What Does Heineken N.V.'s (AMS:HEIA) P/E Ratio Tell You?

The goal of this article is to teach you how to use price to earnings ratios (P/E ratios). We'll apply a basic P/E ratio analysis to Heineken N.V.'s (AMS:HEIA), to help you decide if the stock is worth further research. What is Heineken's P/E ratio? Well, based on the last twelve months it is 29.71. That is equivalent to an earnings yield of about 3.4%.
View our latest analysis for Heineken
How Do You Calculate Heineken's P/E Ratio?
The formula for P/E is:
Price to Earnings Ratio = Share Price ÷ Earnings per Share (EPS)
Or for Heineken:
P/E of 29.71 = €98.34 ÷ €3.31 (Based on the year to June 2019.)
Is A High Price-to-Earnings Ratio Good?
A higher P/E ratio means that investors are paying a higher price for each €1 of company earnings. That isn't a good or a bad thing on its own, but a high P/E means that buyers have a higher opinion of the business's prospects, relative to stocks with a lower P/E.
How Does Heineken's P/E Ratio Compare To Its Peers?
The P/E ratio essentially measures market expectations of a company. You can see in the image below that the average P/E (24.5) for companies in the beverage industry is lower than Heineken's P/E.
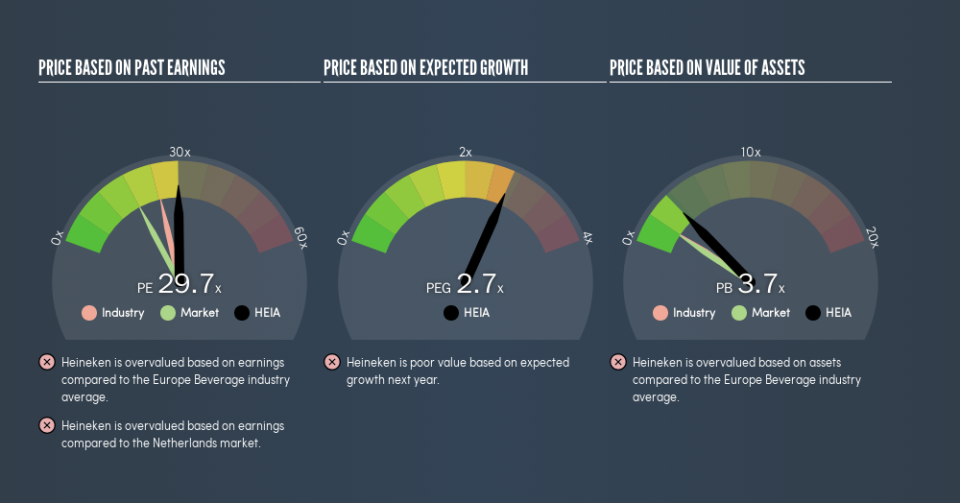
That means that the market expects Heineken will outperform other companies in its industry. Shareholders are clearly optimistic, but the future is always uncertain. So investors should delve deeper. I like to check if company insiders have been buying or selling.
How Growth Rates Impact P/E Ratios
P/E ratios primarily reflect market expectations around earnings growth rates. That's because companies that grow earnings per share quickly will rapidly increase the 'E' in the equation. Therefore, even if you pay a high multiple of earnings now, that multiple will become lower in the future. A lower P/E should indicate the stock is cheap relative to others -- and that may attract buyers.
Heineken's earnings per share fell by 6.3% in the last twelve months. But over the longer term (5 years) earnings per share have increased by 7.0%.
Don't Forget: The P/E Does Not Account For Debt or Bank Deposits
One drawback of using a P/E ratio is that it considers market capitalization, but not the balance sheet. Thus, the metric does not reflect cash or debt held by the company. Theoretically, a business can improve its earnings (and produce a lower P/E in the future) by investing in growth. That means taking on debt (or spending its cash).
Such expenditure might be good or bad, in the long term, but the point here is that the balance sheet is not reflected by this ratio.
Is Debt Impacting Heineken's P/E?
Heineken's net debt equates to 27% of its market capitalization. While that's enough to warrant consideration, it doesn't really concern us.
The Bottom Line On Heineken's P/E Ratio
Heineken's P/E is 29.7 which is above average (17.9) in its market. With modest debt but no EPS growth in the last year, it's fair to say the P/E implies some optimism about future earnings, from the market.
Investors should be looking to buy stocks that the market is wrong about. People often underestimate remarkable growth -- so investors can make money when fast growth is not fully appreciated. So this free visual report on analyst forecasts could hold the key to an excellent investment decision.
You might be able to find a better buy than Heineken. If you want a selection of possible winners, check out this free list of interesting companies that trade on a P/E below 20 (but have proven they can grow earnings).
We aim to bring you long-term focused research analysis driven by fundamental data. Note that our analysis may not factor in the latest price-sensitive company announcements or qualitative material.
If you spot an error that warrants correction, please contact the editor at editorial-team@simplywallst.com. This article by Simply Wall St is general in nature. It does not constitute a recommendation to buy or sell any stock, and does not take account of your objectives, or your financial situation. Simply Wall St has no position in the stocks mentioned. Thank you for reading.
