
 Yahoo Finance
 How Does Halliburton Company (NYSE:HAL) Fare As A Dividend Stock?

Want to participate in a short research study? Help shape the future of investing tools and you could win a $250 gift card!
Today we'll take a closer look at Halliburton Company (NYSE:HAL) from a dividend investor's perspective. Owning a strong business and reinvesting the dividends is widely seen as an attractive way of growing your wealth. Yet sometimes, investors buy a popular dividend stock because of its yield, and then lose money if the company's dividend doesn't live up to expectations.
A high yield and a long history of paying dividends is an appealing combination for Halliburton. We'd guess that plenty of investors have purchased it for the income. The company also bought back stock during the year, equivalent to approximately 1.1% of the company's market capitalisation at the time. Before you buy any stock for its dividend however, you should always remember Warren Buffett's two rules: 1) Don't lose money, and 2) Remember rule #1. We'll run through some checks below to help with this.
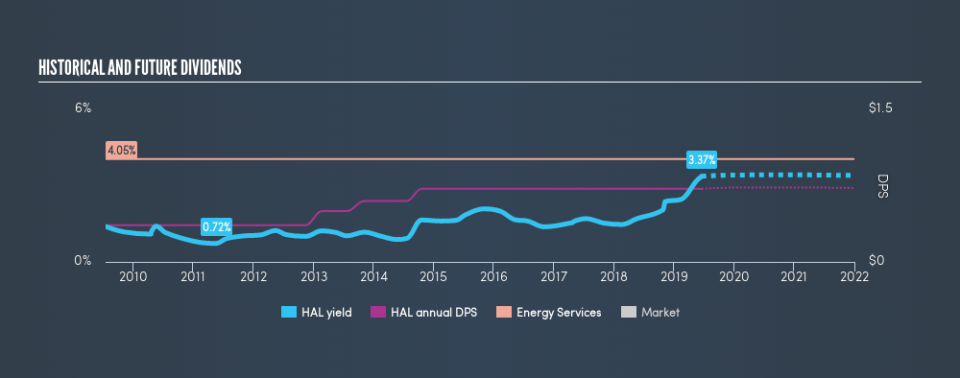
Explore this interactive chart for our latest analysis on Halliburton!
Payout ratios
Companies (usually) pay dividends out of their earnings. If a company is paying more than it earns, the dividend might have to be cut. As a result, we should always investigate whether a company can afford its dividend, measured as a percentage of a company's net income after tax. Looking at the data, we can see that 36% of Halliburton's profits were paid out as dividends in the last 12 months. This is medium payout level that leaves enough capital in the business to fund opportunities that might arise, while also rewarding shareholders. Besides, if reinvestment opportunities dry up, the company has room to increase the dividend.
In addition to comparing dividends against profits, we should inspect whether the company generated enough cash to pay its dividend. Halliburton paid out 109% of its free cash flow last year, which we think is concerning if cash flows do not improve. Halliburton paid out less in dividends than it reported in profits, but unfortunately it didn't generate enough free cash flow to cover the dividend. Were it to repeatedly pay dividends that were not well covered by cash flow, this could be a risk to Halliburton's ability to maintain its dividend.
Is Halliburton's Balance Sheet Risky?
As Halliburton has a meaningful amount of debt, we need to check its balance sheet to see if the company might have debt risks. A rough way to check this is with these two simple ratios: a) net debt divided by EBITDA (earnings before interest, tax, depreciation and amortisation), and b) net interest cover. Net debt to EBITDA is a measure of a company's total debt. Net interest cover measures the ability to meet interest payments on debt. Essentially we check that a) a company does not have too much debt, and b) that it can afford to pay the interest. With net debt of more than twice its EBITDA, Halliburton has a noticeable amount of debt, although if business stays steady, this may not be overly concerning.
Net interest cover can be calculated by dividing earnings before interest and tax (EBIT) by the company's net interest expense. With EBIT of 4.56 times its interest expense, Halliburton's interest cover is starting to look a bit thin.
We update our data on Halliburton every 24 hours, so you can always get our latest analysis of its financial health, here.
Dividend Volatility
One of the major risks of relying on dividend income, is the potential for a company to struggle financially and cut its dividend. Not only is your income cut, but the value of your investment declines as well - nasty. Halliburton has been paying dividends for a long time, but for the purpose of this analysis, we only examine the past 10 years of payments. During this period the dividend has been stable, which could imply the business could have relatively consistent earnings power. During the past ten-year period, the first annual payment was US$0.36 in 2009, compared to US$0.72 last year. This works out to be a compound annual growth rate (CAGR) of approximately 7.2% a year over that time.
Businesses that can grow their dividends at a decent rate and maintain a stable payout can generate substantial wealth for shareholders over the long term.
Dividend Growth Potential
While dividend payments have been relatively reliable, it would also be nice if earnings per share (EPS) were growing, as this is essential to maintaining the dividend's purchasing power over the long term. In the last five years, Halliburton's earnings per share have shrunk at approximately 3.0% per annum. Declining earnings per share over a number of years is not a great sign for the dividend investor. Without some improvement, this does not bode well for the long term value of a company's dividend.
Conclusion
Dividend investors should always want to know if a) a company's dividends are affordable, b) if there is a track record of consistent payments, and c) if the dividend is capable of growing. Firstly, the company has a conservative payout ratio, although we'd note that its cashflow in the past year was substantially lower than its reported profit. Moreover, earnings have been shrinking. While the dividends have been fairly steady, we'd wonder for how much longer this will be sustainable if earnings continue to decline. In sum, we find it hard to get excited about Halliburton from a dividend perspective. It's not that we think it's a bad business; just that there are other companies that perform better on these criteria.
Without at least some growth in earnings per share over time, the dividend will eventually come under pressure either from costs or inflation. Very few businesses see earnings consistently shrink year after year in perpetuity though, and so it might be worth seeing what the 28 analysts we track are forecasting for the future.
Looking for more high-yielding dividend ideas? Try our curated list of dividend stocks with a yield above 3%.
We aim to bring you long-term focused research analysis driven by fundamental data. Note that our analysis may not factor in the latest price-sensitive company announcements or qualitative material.
If you spot an error that warrants correction, please contact the editor at editorial-team@simplywallst.com. This article by Simply Wall St is general in nature. It does not constitute a recommendation to buy or sell any stock, and does not take account of your objectives, or your financial situation. Simply Wall St has no position in the stocks mentioned. Thank you for reading.
