
 Yahoo Finance
 Does Gresham Technologies plc's (LON:GHT) Weak Fundamentals Mean That The Stock Could Move In The Opposite Direction?
Gresham Technologies' (LON:GHT) stock is up by 8.2% over the past three months. However, its weak financial performance indicators makes us a bit doubtful if that trend could continue. Specifically, we decided to study Gresham Technologies' ROE in this article.
Return on equity or ROE is a key measure used to assess how efficiently a company's management is utilizing the company's capital. Simply put, it is used to assess the profitability of a company in relation to its equity capital.
Check out our latest analysis for Gresham Technologies
How Is ROE Calculated?
Return on equity can be calculated by using the formula:
Return on Equity = Net Profit (from continuing operations) ÷ Shareholders' Equity
So, based on the above formula, the ROE for Gresham Technologies is:
0.8% = UK£371k ÷ UK£46m (Based on the trailing twelve months to June 2021).
The 'return' is the yearly profit. One way to conceptualize this is that for each £1 of shareholders' capital it has, the company made £0.01 in profit.
What Is The Relationship Between ROE And Earnings Growth?
We have already established that ROE serves as an efficient profit-generating gauge for a company's future earnings. Based on how much of its profits the company chooses to reinvest or "retain", we are then able to evaluate a company's future ability to generate profits. Assuming all else is equal, companies that have both a higher return on equity and higher profit retention are usually the ones that have a higher growth rate when compared to companies that don't have the same features.
A Side By Side comparison of Gresham Technologies' Earnings Growth And 0.8% ROE
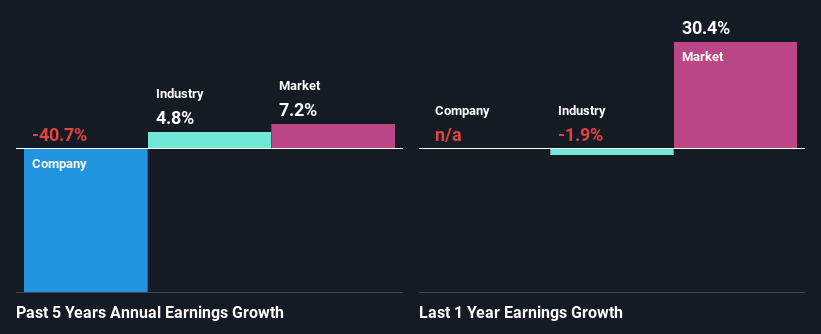
It is hard to argue that Gresham Technologies' ROE is much good in and of itself. Even when compared to the industry average of 9.5%, the ROE figure is pretty disappointing. Given the circumstances, the significant decline in net income by 41% seen by Gresham Technologies over the last five years is not surprising. We believe that there also might be other aspects that are negatively influencing the company's earnings prospects. Such as - low earnings retention or poor allocation of capital.
That being said, we compared Gresham Technologies' performance with the industry and were concerned when we found that while the company has shrunk its earnings, the industry has grown its earnings at a rate of 4.8% in the same period.
Earnings growth is an important metric to consider when valuing a stock. It’s important for an investor to know whether the market has priced in the company's expected earnings growth (or decline). Doing so will help them establish if the stock's future looks promising or ominous. If you're wondering about Gresham Technologies''s valuation, check out this gauge of its price-to-earnings ratio, as compared to its industry.
Is Gresham Technologies Using Its Retained Earnings Effectively?
Gresham Technologies' very high LTM (or last twelve month) payout ratio of 141% over the last three years suggests that the company is paying its shareholders more than what it is earning and this explains the company's shrinking earnings. Its usually very hard to sustain dividend payments that are higher than reported profits. Our risks dashboard should have the 3 risks we have identified for Gresham Technologies.
In addition, Gresham Technologies has been paying dividends over a period of four years suggesting that keeping up dividend payments is preferred by the management even though earnings have been in decline.
Conclusion
Overall, we would be extremely cautious before making any decision on Gresham Technologies. Specifically, it has shown quite an unsatisfactory performance as far as earnings growth is concerned, and a poor ROE and an equally poor rate of reinvestment seem to be the reason behind this inadequate performance. Up till now, we've only made a short study of the company's growth data. So it may be worth checking this free detailed graph of Gresham Technologies' past earnings, as well as revenue and cash flows to get a deeper insight into the company's performance.
This article by Simply Wall St is general in nature. We provide commentary based on historical data and analyst forecasts only using an unbiased methodology and our articles are not intended to be financial advice. It does not constitute a recommendation to buy or sell any stock, and does not take account of your objectives, or your financial situation. We aim to bring you long-term focused analysis driven by fundamental data. Note that our analysis may not factor in the latest price-sensitive company announcements or qualitative material. Simply Wall St has no position in any stocks mentioned.
Have feedback on this article? Concerned about the content? Get in touch with us directly. Alternatively, email editorial-team (at) simplywallst.com.
