
 Yahoo Finance
 Does GP Strategies Corporation’s (NYSE:GPX) CEO Pay Compare Well With Peers?

Scott Greenberg became the CEO of GP Strategies Corporation (NYSE:GPX) in 2005. This report will, first, examine the CEO compensation levels in comparison to CEO compensation at companies of similar size. After that, we will consider the growth in the business. And finally we will reflect on how common stockholders have fared in the last few years, as a secondary measure of performance. This method should give us information to assess how appropriately the company pays the CEO.
See our latest analysis for GP Strategies
Want to help shape the future of investing tools? Participate in a short research study and receive a 6-month subscription to the award winning Simply Wall St research tool (valued at $60)!
How Does Scott Greenberg’s Compensation Compare With Similar Sized Companies?
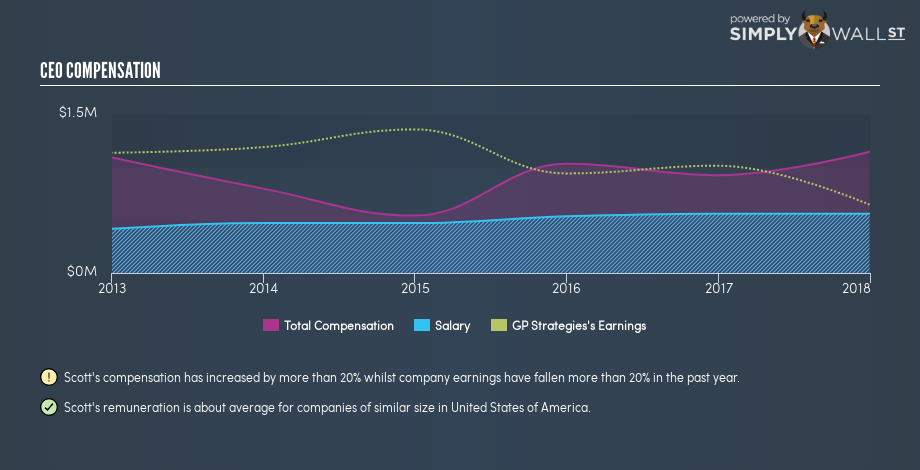
According to our data, GP Strategies Corporation has a market capitalization of US$248m, and pays its CEO total annual compensation worth US$1.1m. (This is based on the year to 2017). While we always look at total compensation first, we note that the salary component is less, at US$560k. When we examined a selection of companies with market caps ranging from US$100m to US$400m, we found the median CEO compensation was US$960k.
So Scott Greenberg is paid around the average of the companies we looked at. This doesn’t tell us a whole lot on its own, but looking at the performance of the actual business will give us useful context.
You can see a visual representation of the CEO compensation at GP Strategies, below.
Is GP Strategies Corporation Growing?
On average over the last three years, GP Strategies Corporation has shrunk earnings per share by 20% each year. It achieved revenue growth of 1.7% over the last year.
Few shareholders would be pleased to read that earnings per share are lower over three years. And the modest revenue growth over 12 months isn’t much comfort against the reduced earnings per share. It’s hard to argue the company is firing on all cylinders, so shareholders might be averse to high CEO remuneration.
It could be important to check this free visual depiction of what analysts expect for the future.
Has GP Strategies Corporation Been A Good Investment?
Since shareholders would have lost about 37% over three years, some GP Strategies Corporation shareholders would surely be feeling negative emotions. So shareholders would probably think the company shouldn’t be too generous with CEO compensation.
In Summary…
Remuneration for Scott Greenberg is close enough to the median pay for a CEO of a similar sized company .
Returns have been disappointing and the company is not growing its earnings per share. Suffice it to say, we don’t think the CEO is underpaid! If you think CEO compensation levels are interesting you will probably really like this free visualization of insider trading at GP Strategies.
Or you could feast your eyes on this interactive graph depicting past earnings, cash flow and revenue.
To help readers see past the short term volatility of the financial market, we aim to bring you a long-term focused research analysis purely driven by fundamental data. Note that our analysis does not factor in the latest price-sensitive company announcements.
The author is an independent contributor and at the time of publication had no position in the stocks mentioned. For errors that warrant correction please contact the editor at editorial-team@simplywallst.com.
