
 Yahoo Finance
 How Does Good Energy Group's (LON:GOOD) P/E Compare To Its Industry, After Its Big Share Price Gain?

Good Energy Group (LON:GOOD) shares have continued recent momentum with a 39% gain in the last month alone. That's tops off a massive gain of 119% in the last year.
Assuming no other changes, a sharply higher share price makes a stock less attractive to potential buyers. In the long term, share prices tend to follow earnings per share, but in the short term prices bounce around in response to short term factors (which are not always obvious). The implication here is that deep value investors might steer clear when expectations of a company are too high. Perhaps the simplest way to get a read on investors' expectations of a business is to look at its Price to Earnings Ratio (PE Ratio). A high P/E ratio means that investors have a high expectation about future growth, while a low P/E ratio means they have low expectations about future growth.
View our latest analysis for Good Energy Group
How Does Good Energy Group's P/E Ratio Compare To Its Peers?
Good Energy Group's P/E of 16.02 indicates relatively low sentiment towards the stock. We can see in the image below that the average P/E (24.1) for companies in the renewable energy industry is higher than Good Energy Group's P/E.
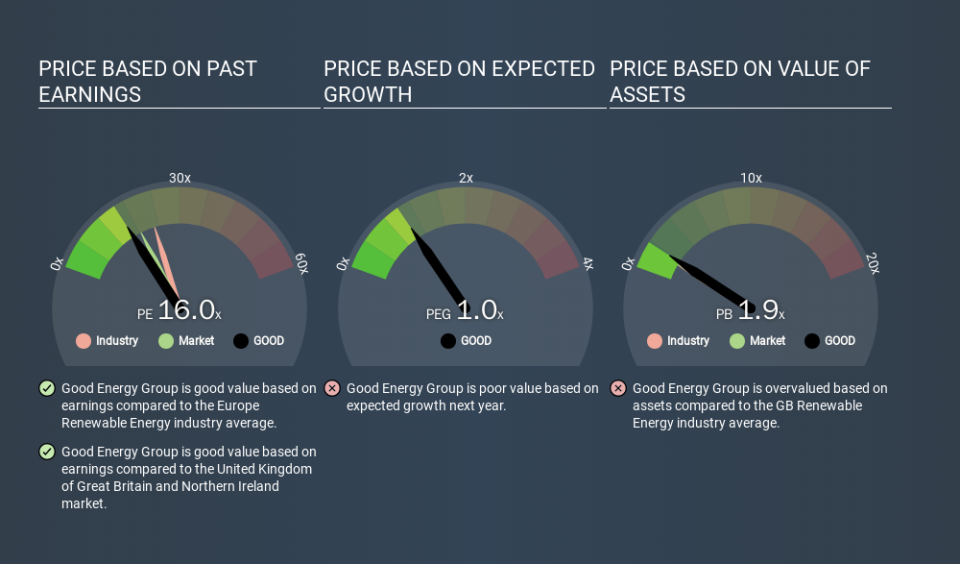
This suggests that market participants think Good Energy Group will underperform other companies in its industry. Since the market seems unimpressed with Good Energy Group, it's quite possible it could surprise on the upside. It is arguably worth checking if insiders are buying shares, because that might imply they believe the stock is undervalued.
How Growth Rates Impact P/E Ratios
Earnings growth rates have a big influence on P/E ratios. That's because companies that grow earnings per share quickly will rapidly increase the 'E' in the equation. That means even if the current P/E is high, it will reduce over time if the share price stays flat. Then, a lower P/E should attract more buyers, pushing the share price up.
Good Energy Group's earnings per share grew by -3.1% in the last twelve months. And its annual EPS growth rate over 3 years is 77%.
A Limitation: P/E Ratios Ignore Debt and Cash In The Bank
Don't forget that the P/E ratio considers market capitalization. That means it doesn't take debt or cash into account. In theory, a company can lower its future P/E ratio by using cash or debt to invest in growth.
Such spending might be good or bad, overall, but the key point here is that you need to look at debt to understand the P/E ratio in context.
So What Does Good Energy Group's Balance Sheet Tell Us?
Good Energy Group has net debt worth a very significant 106% of its market capitalization. This level of debt justifies a relatively low P/E, so remain cognizant of the debt, if you're comparing it to other stocks.
The Verdict On Good Energy Group's P/E Ratio
Good Energy Group has a P/E of 16.0. That's below the average in the GB market, which is 18.3. While the recent EPS growth is a positive, the significant amount of debt on the balance sheet may be contributing to pessimistic market expectations. What we know for sure is that investors have become more excited about Good Energy Group recently, since they have pushed its P/E ratio from 11.5 to 16.0 over the last month. If you like to buy stocks that have recently impressed the market, then this one might be a candidate; but if you prefer to invest when there is 'blood in the streets', then you may feel the opportunity has passed.
When the market is wrong about a stock, it gives savvy investors an opportunity. As value investor Benjamin Graham famously said, 'In the short run, the market is a voting machine but in the long run, it is a weighing machine. So this free visualization of the analyst consensus on future earnings could help you make the right decision about whether to buy, sell, or hold.
Of course, you might find a fantastic investment by looking at a few good candidates. So take a peek at this free list of companies with modest (or no) debt, trading on a P/E below 20.
If you spot an error that warrants correction, please contact the editor at editorial-team@simplywallst.com. This article by Simply Wall St is general in nature. It does not constitute a recommendation to buy or sell any stock, and does not take account of your objectives, or your financial situation. Simply Wall St has no position in the stocks mentioned.
We aim to bring you long-term focused research analysis driven by fundamental data. Note that our analysis may not factor in the latest price-sensitive company announcements or qualitative material. Thank you for reading.
