
 Yahoo Finance
 How Does Fortuna Silver Mines's (TSE:FVI) P/E Compare To Its Industry, After The Share Price Drop?

To the annoyance of some shareholders, Fortuna Silver Mines (TSE:FVI) shares are down a considerable 43% in the last month. That drop has capped off a tough year for shareholders, with the share price down 45% in that time.
All else being equal, a share price drop should make a stock more attractive to potential investors. While the market sentiment towards a stock is very changeable, in the long run, the share price will tend to move in the same direction as earnings per share. The implication here is that long term investors have an opportunity when expectations of a company are too low. Perhaps the simplest way to get a read on investors' expectations of a business is to look at its Price to Earnings Ratio (PE Ratio). A high P/E implies that investors have high expectations of what a company can achieve compared to a company with a low P/E ratio.
View our latest analysis for Fortuna Silver Mines
Does Fortuna Silver Mines Have A Relatively High Or Low P/E For Its Industry?
Fortuna Silver Mines's P/E of 13.82 indicates some degree of optimism towards the stock. You can see in the image below that the average P/E (11.2) for companies in the metals and mining industry is lower than Fortuna Silver Mines's P/E.
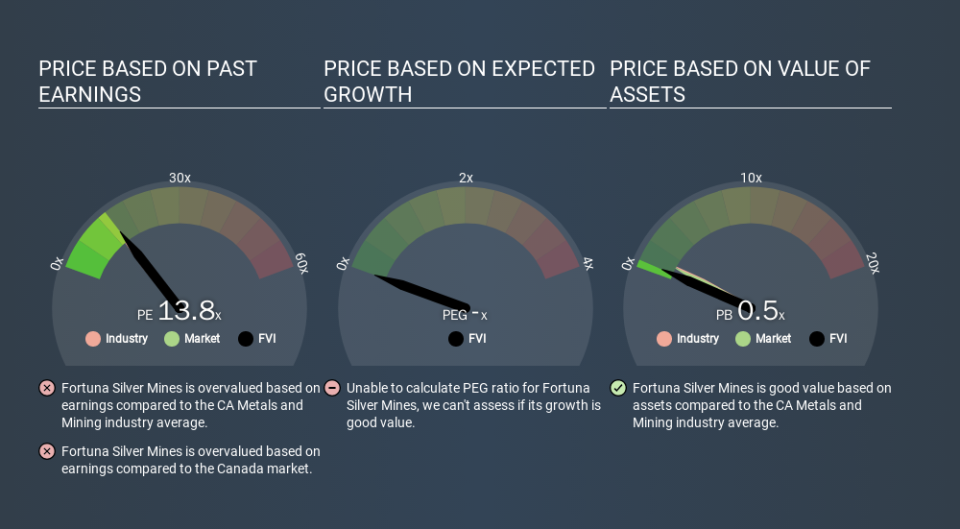
That means that the market expects Fortuna Silver Mines will outperform other companies in its industry. Clearly the market expects growth, but it isn't guaranteed. So further research is always essential. I often monitor director buying and selling.
How Growth Rates Impact P/E Ratios
Generally speaking the rate of earnings growth has a profound impact on a company's P/E multiple. When earnings grow, the 'E' increases, over time. And in that case, the P/E ratio itself will drop rather quickly. And as that P/E ratio drops, the company will look cheap, unless its share price increases.
Fortuna Silver Mines's earnings per share fell by 30% in the last twelve months. But over the longer term (5 years) earnings per share have increased by 3.8%.
Don't Forget: The P/E Does Not Account For Debt or Bank Deposits
One drawback of using a P/E ratio is that it considers market capitalization, but not the balance sheet. Thus, the metric does not reflect cash or debt held by the company. In theory, a company can lower its future P/E ratio by using cash or debt to invest in growth.
Such spending might be good or bad, overall, but the key point here is that you need to look at debt to understand the P/E ratio in context.
Is Debt Impacting Fortuna Silver Mines's P/E?
Net debt totals 19% of Fortuna Silver Mines's market cap. It would probably deserve a higher P/E ratio if it was net cash, since it would have more options for growth.
The Bottom Line On Fortuna Silver Mines's P/E Ratio
Fortuna Silver Mines's P/E is 13.8 which is above average (11.6) in its market. With modest debt but no EPS growth in the last year, it's fair to say the P/E implies some optimism about future earnings, from the market. Given Fortuna Silver Mines's P/E ratio has declined from 24.1 to 13.8 in the last month, we know for sure that the market is significantly less confident about the business today, than it was back then. For those who don't like to trade against momentum, that could be a warning sign, but a contrarian investor might want to take a closer look.
Investors have an opportunity when market expectations about a stock are wrong. People often underestimate remarkable growth -- so investors can make money when fast growth is not fully appreciated. Although we don't have analyst forecasts you could get a better understanding of its growth by checking out this more detailed historical graph of earnings, revenue and cash flow.
Of course, you might find a fantastic investment by looking at a few good candidates. So take a peek at this free list of companies with modest (or no) debt, trading on a P/E below 20.
If you spot an error that warrants correction, please contact the editor at editorial-team@simplywallst.com. This article by Simply Wall St is general in nature. It does not constitute a recommendation to buy or sell any stock, and does not take account of your objectives, or your financial situation. Simply Wall St has no position in the stocks mentioned.
We aim to bring you long-term focused research analysis driven by fundamental data. Note that our analysis may not factor in the latest price-sensitive company announcements or qualitative material. Thank you for reading.
