
 Yahoo Finance
 Does Fancamp Exploration Ltd. (CVE:FNC) Have A Particularly Volatile Share Price?

If you're interested in Fancamp Exploration Ltd. (CVE:FNC), then you might want to consider its beta (a measure of share price volatility) in order to understand how the stock could impact your portfolio. Modern finance theory considers volatility to be a measure of risk, and there are two main types of price volatility. First, we have company specific volatility, which is the price gyrations of an individual stock. Holding at least 8 stocks can reduce this kind of risk across a portfolio. The second type is the broader market volatility, which you cannot diversify away, since it arises from macroeconomic factors which directly affects all the stocks on the market.
Some stocks see their prices move in concert with the market. Others tend towards stronger, gentler or unrelated price movements. Beta can be a useful tool to understand how much a stock is influenced by market risk (volatility). However, Warren Buffett said 'volatility is far from synonymous with risk' in his 2014 letter to investors. So, while useful, beta is not the only metric to consider. To use beta as an investor, you must first understand that the overall market has a beta of one. Any stock with a beta of greater than one is considered more volatile than the market, while those with a beta below one are either less volatile or poorly correlated with the market.
Check out our latest analysis for Fancamp Exploration
What FNC's beta value tells investors
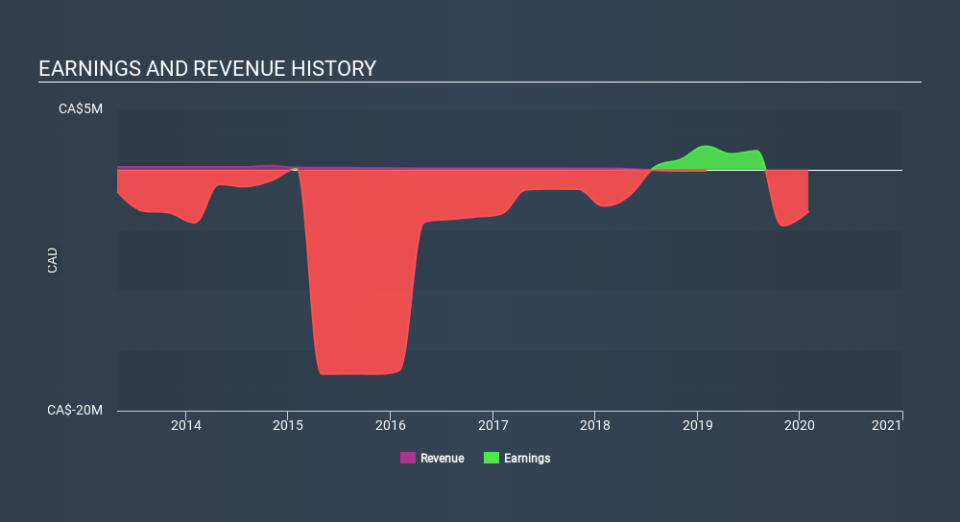
Looking at the last five years, Fancamp Exploration has a beta of 1.31. The fact that this is well above 1 indicates that its share price movements have shown sensitivity to overall market volatility. If this beta value holds true in the future, Fancamp Exploration shares are likely to rise more than the market when the market is going up, but fall faster when the market is going down. Many would argue that beta is useful in position sizing, but fundamental metrics such as revenue and earnings are more important overall. You can see Fancamp Exploration's revenue and earnings in the image below.
Does FNC's size influence the expected beta?
With a market capitalisation of CA$6.4m, Fancamp Exploration is a very small company by global standards. It is quite likely to be unknown to most investors. Relatively few investors can influence the price of a smaller company, compared to a large company. This could explain the high beta value, in this case.
What this means for you:
Since Fancamp Exploration has a reasonably high beta, it's worth considering why it is so heavily influenced by broader market sentiment. For example, it might be a high growth stock or have a lot of operating leverage in its business model. This article aims to educate investors about beta values, but it's well worth looking at important company-specific fundamentals such as Fancamp Exploration’s financial health and performance track record. I urge you to continue your research by taking a look at the following:
Valuation: What is FNC worth today? Is the stock undervalued, even when its growth outlook is factored into its intrinsic value? The intrinsic value infographic in our free research report helps visualize whether FNC is currently mispriced by the market.
Past Track Record: Has FNC been consistently performing well irrespective of the ups and downs in the market? Go into more detail in the past performance analysis and take a look at the free visual representations of FNC's historicals for more clarity.
Other High-Performing Stocks: Are there other stocks that provide better prospects with proven track records? Explore our free list of these great stocks here.
If you spot an error that warrants correction, please contact the editor at editorial-team@simplywallst.com. This article by Simply Wall St is general in nature. It does not constitute a recommendation to buy or sell any stock, and does not take account of your objectives, or your financial situation. Simply Wall St has no position in the stocks mentioned.
We aim to bring you long-term focused research analysis driven by fundamental data. Note that our analysis may not factor in the latest price-sensitive company announcements or qualitative material. Thank you for reading.
