
 Yahoo Finance
 Does East West Bancorp's (NASDAQ:EWBC) Share Price Gain of 41% Match Its Business Performance?

While East West Bancorp, Inc. (NASDAQ:EWBC) shareholders are probably generally happy, the stock hasn't had particularly good run recently, with the share price falling 12% in the last quarter. But at least the stock is up over the last five years. However we are not very impressed because the share price is only up 41%, less than the market return of 58%.
Want to participate in a short research study? Help shape the future of investing tools and you could win a $250 gift card!
See our latest analysis for East West Bancorp
To paraphrase Benjamin Graham: Over the short term the market is a voting machine, but over the long term it's a weighing machine. One way to examine how market sentiment has changed over time is to look at the interaction between a company's share price and its earnings per share (EPS).
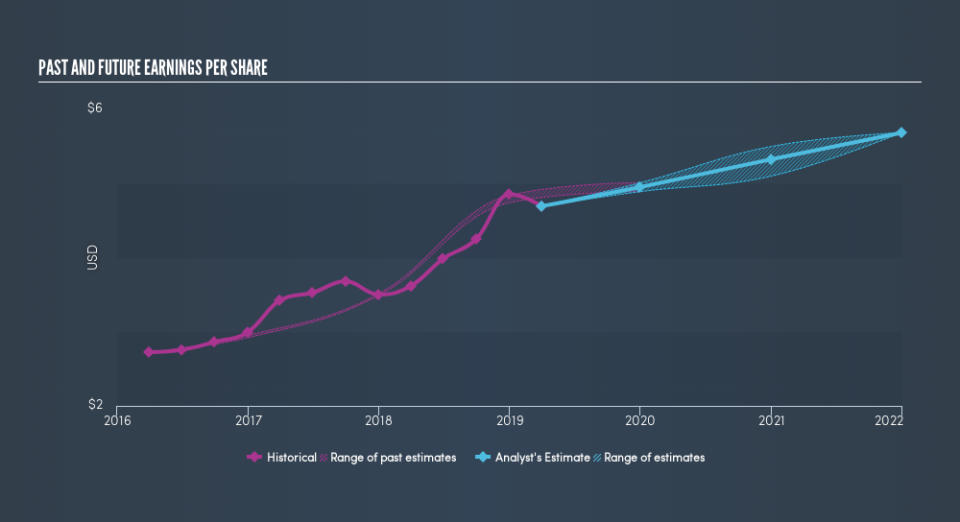
During five years of share price growth, East West Bancorp achieved compound earnings per share (EPS) growth of 17% per year. This EPS growth is higher than the 7.1% average annual increase in the share price. So it seems the market isn't so enthusiastic about the stock these days. The reasonably low P/E ratio of 9.98 also suggests market apprehension.
You can see below how EPS has changed over time (discover the exact values by clicking on the image).
We know that East West Bancorp has improved its bottom line lately, but is it going to grow revenue? You could check out this free report showing analyst revenue forecasts.
What About Dividends?
When looking at investment returns, it is important to consider the difference between total shareholder return (TSR) and share price return. The TSR is a return calculation that accounts for the value of cash dividends (assuming that any dividend received was reinvested) and the calculated value of any discounted capital raisings and spin-offs. It's fair to say that the TSR gives a more complete picture for stocks that pay a dividend. As it happens, East West Bancorp's TSR for the last 5 years was 54%, which exceeds the share price return mentioned earlier. And there's no prize for guessing that the dividend payments largely explain the divergence!
A Different Perspective
Investors in East West Bancorp had a tough year, with a total loss of 32% (including dividends), against a market gain of about 3.5%. Even the share prices of good stocks drop sometimes, but we want to see improvements in the fundamental metrics of a business, before getting too interested. On the bright side, long term shareholders have made money, with a gain of 9.0% per year over half a decade. It could be that the recent sell-off is an opportunity, so it may be worth checking the fundamental data for signs of a long term growth trend. Most investors take the time to check the data on insider transactions. You can click here to see if insiders have been buying or selling.
But note: East West Bancorp may not be the best stock to buy. So take a peek at this free list of interesting companies with past earnings growth (and further growth forecast).
Please note, the market returns quoted in this article reflect the market weighted average returns of stocks that currently trade on US exchanges.
We aim to bring you long-term focused research analysis driven by fundamental data. Note that our analysis may not factor in the latest price-sensitive company announcements or qualitative material.
If you spot an error that warrants correction, please contact the editor at editorial-team@simplywallst.com. This article by Simply Wall St is general in nature. It does not constitute a recommendation to buy or sell any stock, and does not take account of your objectives, or your financial situation. Simply Wall St has no position in the stocks mentioned. Thank you for reading.
