
 Yahoo Finance
 Does Corridor Resources Inc.'s (TSE:CDH) CEO Pay Compare Well With Peers?

Steve Moran has been the CEO of Corridor Resources Inc. (TSE:CDH) since 2014. First, this article will compare CEO compensation with compensation at similar sized companies. Next, we'll consider growth that the business demonstrates. And finally we will reflect on how common stockholders have fared in the last few years, as a secondary measure of performance. This method should give us information to assess how appropriately the company pays the CEO.
See our latest analysis for Corridor Resources
How Does Steve Moran's Compensation Compare With Similar Sized Companies?
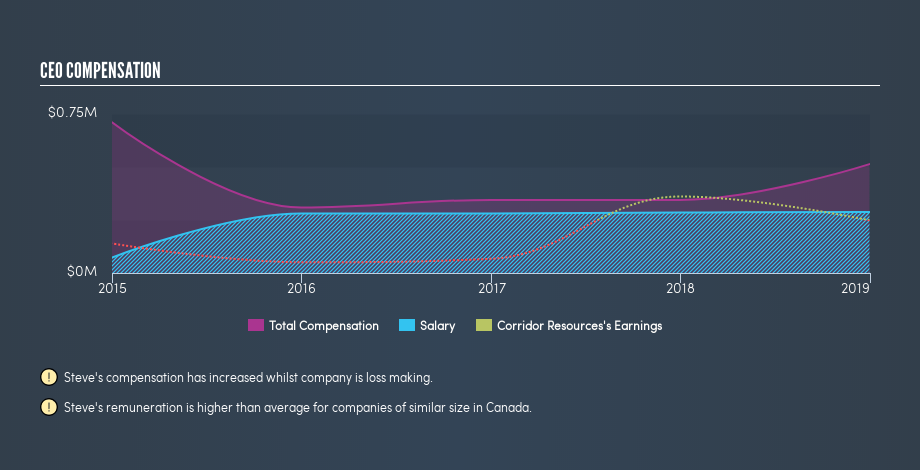
At the time of writing our data says that Corridor Resources Inc. has a market cap of CA$58m, and is paying total annual CEO compensation of CA$514k. (This is based on the year to December 2018). While we always look at total compensation first, we note that the salary component is less, at CA$288k. We examined a group of similar sized companies, with market capitalizations of below CA$263m. The median CEO total compensation in that group is CA$120k.
As you can see, Steve Moran is paid more than the median CEO pay at companies of a similar size, in the same market. However, this does not necessarily mean Corridor Resources Inc. is paying too much. We can get a better idea of how generous the pay is by looking at the performance of the underlying business.
The graphic below shows how CEO compensation at Corridor Resources has changed from year to year.
Is Corridor Resources Inc. Growing?
Corridor Resources Inc. has increased its earnings per share (EPS) by an average of 97% a year, over the last three years (using a line of best fit). In the last year, its revenue is down -25%.
Overall this is a positive result for shareholders, showing that the company has improved in recent years. The lack of revenue growth isn't ideal, but it is the bottom line that counts most in business. Although we don't have analyst forecasts, you could get a better understanding of its growth by checking out this more detailed historical graph of earnings, revenue and cash flow.
Has Corridor Resources Inc. Been A Good Investment?
Most shareholders would probably be pleased with Corridor Resources Inc. for providing a total return of 65% over three years. So they may not be at all concerned if the CEO were to be paid more than is normal for companies around the same size.
In Summary...
We compared the total CEO remuneration paid by Corridor Resources Inc., and compared it to remuneration at a group of similar sized companies. Our data suggests that it pays above the median CEO pay within that group.
However, the earnings per share growth over three years is certainly impressive. In addition, shareholders have done well over the same time period. As a result of this good performance, the CEO remuneration may well be quite reasonable. If you think CEO compensation levels are interesting you will probably really like this free visualization of insider trading at Corridor Resources.
Arguably, business quality is much more important than CEO compensation levels. So check out this free list of interesting companies, that have HIGH return on equity and low debt.
We aim to bring you long-term focused research analysis driven by fundamental data. Note that our analysis may not factor in the latest price-sensitive company announcements or qualitative material.
If you spot an error that warrants correction, please contact the editor at editorial-team@simplywallst.com. This article by Simply Wall St is general in nature. It does not constitute a recommendation to buy or sell any stock, and does not take account of your objectives, or your financial situation. Simply Wall St has no position in the stocks mentioned. Thank you for reading.
