
 Yahoo Finance
 What Does Core Laboratories N.V.'s (NYSE:CLB) P/E Ratio Tell You?

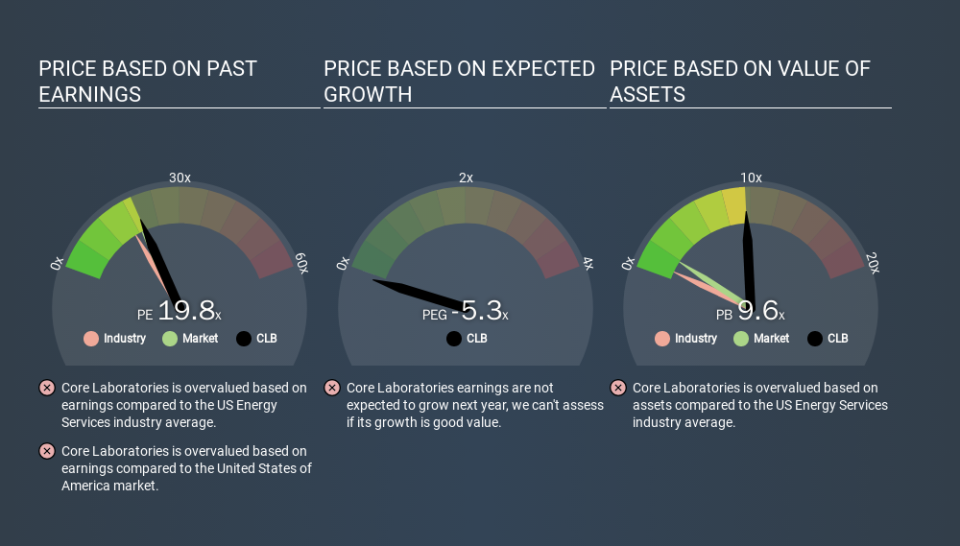
The goal of this article is to teach you how to use price to earnings ratios (P/E ratios). We'll apply a basic P/E ratio analysis to Core Laboratories N.V.'s (NYSE:CLB), to help you decide if the stock is worth further research. Core Laboratories has a price to earnings ratio of 19.81, based on the last twelve months. That means that at current prices, buyers pay $19.81 for every $1 in trailing yearly profits.
View our latest analysis for Core Laboratories
How Do You Calculate A P/E Ratio?
The formula for P/E is:
Price to Earnings Ratio = Price per Share ÷ Earnings per Share (EPS)
Or for Core Laboratories:
P/E of 19.81 = $41.24 ÷ $2.08 (Based on the trailing twelve months to September 2019.)
Is A High P/E Ratio Good?
A higher P/E ratio means that buyers have to pay a higher price for each $1 the company has earned over the last year. That isn't a good or a bad thing on its own, but a high P/E means that buyers have a higher opinion of the business's prospects, relative to stocks with a lower P/E.
Does Core Laboratories Have A Relatively High Or Low P/E For Its Industry?
The P/E ratio essentially measures market expectations of a company. As you can see below, Core Laboratories has a higher P/E than the average company (16.4) in the energy services industry.
Its relatively high P/E ratio indicates that Core Laboratories shareholders think it will perform better than other companies in its industry classification. The market is optimistic about the future, but that doesn't guarantee future growth. So investors should delve deeper. I like to check if company insiders have been buying or selling.
How Growth Rates Impact P/E Ratios
Probably the most important factor in determining what P/E a company trades on is the earnings growth. When earnings grow, the 'E' increases, over time. Therefore, even if you pay a high multiple of earnings now, that multiple will become lower in the future. So while a stock may look expensive based on past earnings, it could be cheap based on future earnings.
Core Laboratories had pretty flat EPS growth in the last year. But it has grown its earnings per share by 12% per year over the last three years. And it has shrunk its earnings per share by 18% per year over the last five years. So you wouldn't expect a very high P/E.
Remember: P/E Ratios Don't Consider The Balance Sheet
It's important to note that the P/E ratio considers the market capitalization, not the enterprise value. That means it doesn't take debt or cash into account. Theoretically, a business can improve its earnings (and produce a lower P/E in the future) by investing in growth. That means taking on debt (or spending its cash).
While growth expenditure doesn't always pay off, the point is that it is a good option to have; but one that the P/E ratio ignores.
How Does Core Laboratories's Debt Impact Its P/E Ratio?
Core Laboratories has net debt worth 16% of its market capitalization. This could bring some additional risk, and reduce the number of investment options for management; worth remembering if you compare its P/E to businesses without debt.
The Bottom Line On Core Laboratories's P/E Ratio
Core Laboratories trades on a P/E ratio of 19.8, which is fairly close to the US market average of 18.7. When you consider the lack of EPS growth last year (along with some debt), it seems the market is optimistic about the future for the business.
When the market is wrong about a stock, it gives savvy investors an opportunity. People often underestimate remarkable growth -- so investors can make money when fast growth is not fully appreciated. So this free visual report on analyst forecasts could hold the key to an excellent investment decision.
But note: Core Laboratories may not be the best stock to buy. So take a peek at this free list of interesting companies with strong recent earnings growth (and a P/E ratio below 20).
If you spot an error that warrants correction, please contact the editor at editorial-team@simplywallst.com. This article by Simply Wall St is general in nature. It does not constitute a recommendation to buy or sell any stock, and does not take account of your objectives, or your financial situation. Simply Wall St has no position in the stocks mentioned.
We aim to bring you long-term focused research analysis driven by fundamental data. Note that our analysis may not factor in the latest price-sensitive company announcements or qualitative material. Thank you for reading.
