
 Yahoo Finance
 How Does Continental Resources's (NYSE:CLR) P/E Compare To Its Industry, After Its Big Share Price Gain?

Continental Resources (NYSE:CLR) shareholders are no doubt pleased to see that the share price has bounced 48% in the last month alone, although it is still down 57% over the last quarter. But that will do little to salve the savage burn caused by the 74% share price decline, over the last year.
Assuming no other changes, a sharply higher share price makes a stock less attractive to potential buyers. In the long term, share prices tend to follow earnings per share, but in the short term prices bounce around in response to short term factors (which are not always obvious). So some would prefer to hold off buying when there is a lot of optimism towards a stock. Perhaps the simplest way to get a read on investors' expectations of a business is to look at its Price to Earnings Ratio (PE Ratio). A high P/E implies that investors have high expectations of what a company can achieve compared to a company with a low P/E ratio.
View our latest analysis for Continental Resources
How Does Continental Resources's P/E Ratio Compare To Its Peers?
We can tell from its P/E ratio of 6.02 that sentiment around Continental Resources isn't particularly high. The image below shows that Continental Resources has a lower P/E than the average (8.5) P/E for companies in the oil and gas industry.
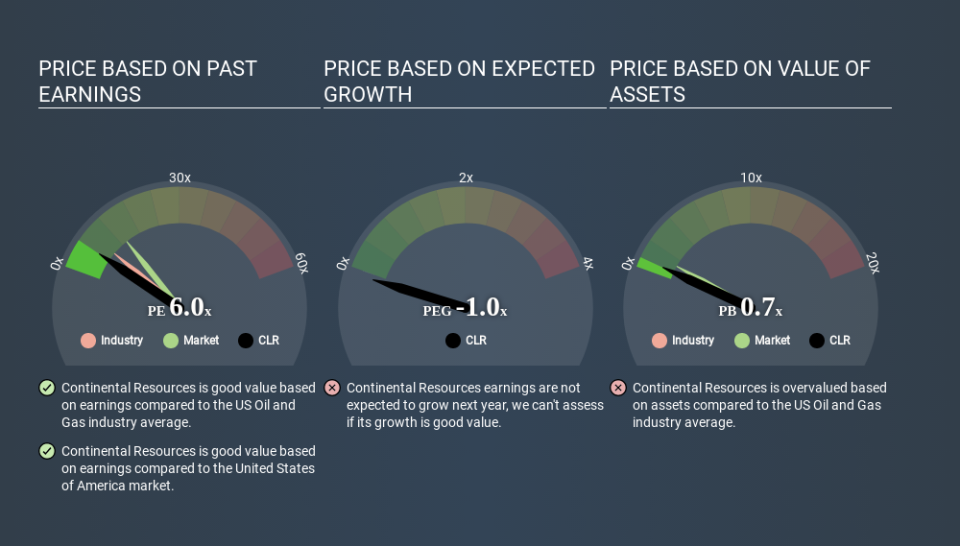
This suggests that market participants think Continental Resources will underperform other companies in its industry. While current expectations are low, the stock could be undervalued if the situation is better than the market assumes. You should delve deeper. I like to check if company insiders have been buying or selling.
How Growth Rates Impact P/E Ratios
P/E ratios primarily reflect market expectations around earnings growth rates. If earnings are growing quickly, then the 'E' in the equation will increase faster than it would otherwise. And in that case, the P/E ratio itself will drop rather quickly. Then, a lower P/E should attract more buyers, pushing the share price up.
Continental Resources's earnings per share fell by 21% in the last twelve months. And over the longer term (5 years) earnings per share have decreased 4.6% annually. This could justify a pessimistic P/E.
Remember: P/E Ratios Don't Consider The Balance Sheet
The 'Price' in P/E reflects the market capitalization of the company. So it won't reflect the advantage of cash, or disadvantage of debt. The exact same company would hypothetically deserve a higher P/E ratio if it had a strong balance sheet, than if it had a weak one with lots of debt, because a cashed up company can spend on growth.
Such expenditure might be good or bad, in the long term, but the point here is that the balance sheet is not reflected by this ratio.
How Does Continental Resources's Debt Impact Its P/E Ratio?
Continental Resources's net debt is considerable, at 114% of its market cap. This is a relatively high level of debt, so the stock probably deserves a relatively low P/E ratio. Keep that in mind when comparing it to other companies.
The Bottom Line On Continental Resources's P/E Ratio
Continental Resources has a P/E of 6.0. That's below the average in the US market, which is 13.5. The P/E reflects market pessimism that probably arises from the lack of recent EPS growth, paired with significant leverage. What we know for sure is that investors are becoming less uncomfortable about Continental Resources's prospects, since they have pushed its P/E ratio from 4.1 to 6.0 over the last month. If you like to buy stocks that could be turnaround opportunities, then this one might be a candidate; but if you're more sensitive to price, then you may feel the opportunity has passed.
When the market is wrong about a stock, it gives savvy investors an opportunity. As value investor Benjamin Graham famously said, 'In the short run, the market is a voting machine but in the long run, it is a weighing machine. So this free report on the analyst consensus forecasts could help you make a master move on this stock.
You might be able to find a better buy than Continental Resources. If you want a selection of possible winners, check out this free list of interesting companies that trade on a P/E below 20 (but have proven they can grow earnings).
If you spot an error that warrants correction, please contact the editor at editorial-team@simplywallst.com. This article by Simply Wall St is general in nature. It does not constitute a recommendation to buy or sell any stock, and does not take account of your objectives, or your financial situation. Simply Wall St has no position in the stocks mentioned.
We aim to bring you long-term focused research analysis driven by fundamental data. Note that our analysis may not factor in the latest price-sensitive company announcements or qualitative material. Thank you for reading.
