
 Yahoo Finance
 How Does Compass Group PLC (LON:CPG) Fare As A Dividend Stock?

Dividend paying stocks like Compass Group PLC (LON:CPG) tend to be popular with investors, and for good reason - some research suggests a significant amount of all stock market returns come from reinvested dividends. If you are hoping to live on the income from dividends, it's important to be a lot more stringent with your investments than the average punter.
With a 2.1% yield and a nine-year payment history, investors probably think Compass Group looks like a reliable dividend stock. While the yield may not look too great, the relatively long payment history is interesting. Some simple analysis can offer a lot of insights when buying a company for its dividend, and we'll go through this below.
Explore this interactive chart for our latest analysis on Compass Group!
Want to participate in a short research study? Help shape the future of investing tools and you could win a $250 gift card!
Payout ratios
Companies (usually) pay dividends out of their earnings. If a company is paying more than it earns, the dividend might have to be cut. As a result, we should always investigate whether a company can afford its dividend, measured as a percentage of a company's net income after tax. Looking at the data, we can see that 52% of Compass Group's profits were paid out as dividends in the last 12 months. A payout ratio above 50% generally implies a business is reaching maturity, although it is still possible to reinvest in the business or increase the dividend over time.
Another important check we do is to see if the free cash flow generated is sufficient to pay the dividend. Compass Group paid out a conservative 49% of its free cash flow as dividends last year. It's positive to see that Compass Group's dividend is covered by both profits and cash flow, since this is generally a sign that the dividend is sustainable, and a lower payout ratio usually suggests a greater margin of safety before the dividend gets cut.
Remember, you can always get a snapshot of Compass Group's latest financial position, by checking our visualisation of its financial health.
Dividend Volatility
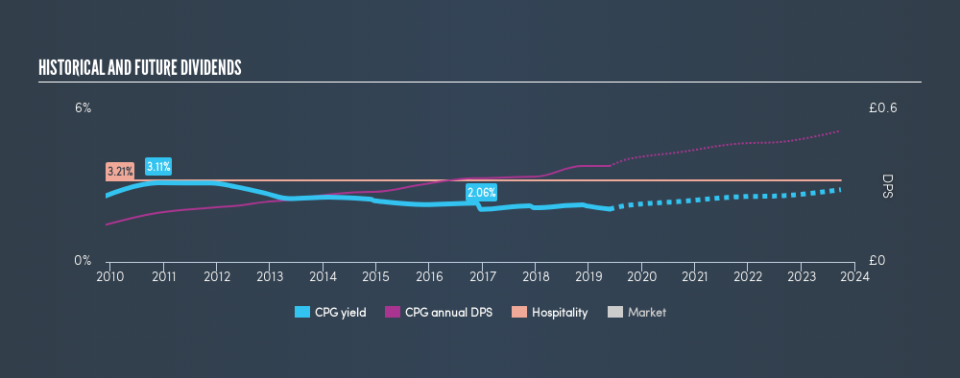
From the perspective of an income investor who wants to earn dividends for many years, there is not much point buying a stock if its dividend is regularly cut or is not reliable. Looking at the last decade of data, we can see that Compass Group paid its first dividend at least nine years ago. The dividend has been quite stable over the past nine years, which is great to see - although we usually like to see the dividend maintained for a decade before giving it full marks, though. During the past nine-year period, the first annual payment was UK£0.15 in 2010, compared to UK£0.38 last year. This works out to be a compound annual growth rate (CAGR) of approximately 11% a year over that time.
Compass Group has been growing its dividend quite rapidly, which is exciting. However, the short payment history makes us question whether this performance will persist across a full market cycle.
Dividend Growth Potential
The other half of the dividend investing equation is evaluating whether earnings per share (EPS) are growing. Growing EPS can help maintain or increase the purchasing power of the dividend over the long run. It's good to see Compass Group has been growing its earnings per share at 23% a year over the past 5 years. Earnings per share are sharply up, but we wonder if paying out more than half its earnings (leaving less for reinvestment) is an implicit signal that Compass Group's growth will be slower in the future.
Conclusion
Dividend investors should always want to know if a) a company's dividends are affordable, b) if there is a track record of consistent payments, and c) if the dividend is capable of growing. First, we think Compass Group has an acceptable payout ratio and its dividend is well covered by cashflow. We were also glad to see it growing earnings, although its dividend history is not as long as we'd like. Compass Group has a number of positive attributes, but it falls slightly short of our (admittedly high) standards. Were there evidence of a strong moat or an attractive valuation, it could still be well worth a look.
Companies that are growing earnings tend to be the best dividend stocks over the long term. See what the 22 analysts we track are forecasting for Compass Group for free with public analyst estimates for the company.
If you are a dividend investor, you might also want to look at our curated list of dividend stocks yielding above 3%.
We aim to bring you long-term focused research analysis driven by fundamental data. Note that our analysis may not factor in the latest price-sensitive company announcements or qualitative material.
If you spot an error that warrants correction, please contact the editor at editorial-team@simplywallst.com. This article by Simply Wall St is general in nature. It does not constitute a recommendation to buy or sell any stock, and does not take account of your objectives, or your financial situation. Simply Wall St has no position in the stocks mentioned. Thank you for reading.
