
 Yahoo Finance
 What does Commercial Metals Company’s (NYSE:CMC) Balance Sheet Tell Us About Its Future?
Small-cap and large-cap companies receive a lot of attention from investors, but mid-cap stocks like Commercial Metals Company (NYSE:CMC), with a market cap of US$2.3b, are often out of the spotlight. However, generally ignored mid-caps have historically delivered better risk adjusted returns than both of those groups. CMC’s financial liquidity and debt position will be analysed in this article, to get an idea of whether the company can fund opportunities for strategic growth and maintain strength through economic downturns. Note that this commentary is very high-level and solely focused on financial health, so I suggest you dig deeper yourself into CMC here.
Check out our latest analysis for Commercial Metals
Does CMC produce enough cash relative to debt?
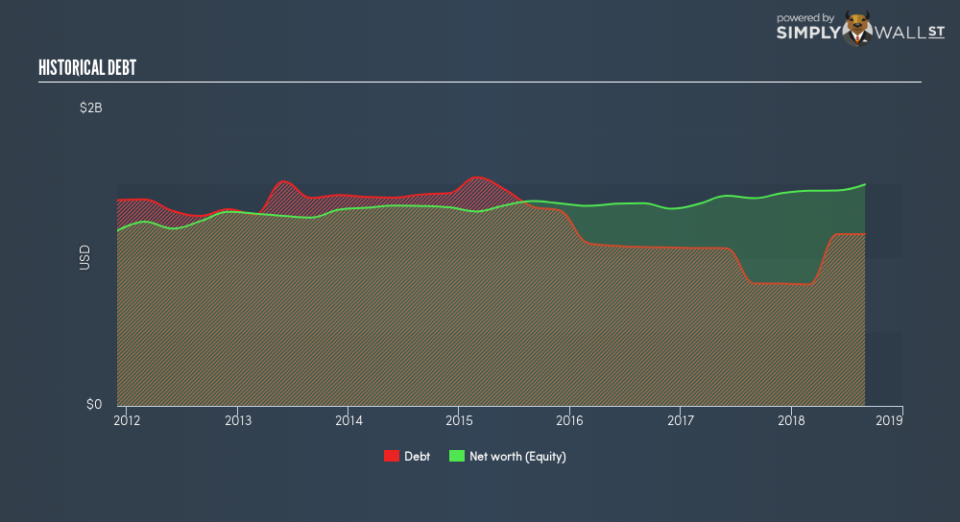
CMC has built up its total debt levels in the last twelve months, from US$825m to US$1.2b – this includes long-term debt. With this increase in debt, CMC currently has US$622m remaining in cash and short-term investments , ready to deploy into the business. Moreover, CMC has generated US$159m in operating cash flow over the same time period, leading to an operating cash to total debt ratio of 14%, meaning that CMC’s current level of operating cash is not high enough to cover debt. This ratio can also be a sign of operational efficiency as an alternative to return on assets. In CMC’s case, it is able to generate 0.14x cash from its debt capital.
Does CMC’s liquid assets cover its short-term commitments?
With current liabilities at US$542m, it appears that the company has been able to meet these obligations given the level of current assets of US$2.1b, with a current ratio of 3.83x. However, a ratio above 3x may be considered excessive by some investors, yet this is not usually a major negative for a company.
Does CMC face the risk of succumbing to its debt-load?
With debt reaching 78% of equity, CMC may be thought of as relatively highly levered. This is not unusual for mid-caps as debt tends to be a cheaper and faster source of funding for some businesses. We can test if CMC’s debt levels are sustainable by measuring interest payments against earnings of a company. Ideally, earnings before interest and tax (EBIT) should cover net interest by at least three times. For CMC, the ratio of 5.39x suggests that interest is appropriately covered, which means that lenders may be less hesitant to lend out more funding as CMC’s high interest coverage is seen as responsible and safe practice.
Next Steps:
Although CMC’s debt level is towards the higher end of the spectrum, its cash flow coverage seems adequate to meet obligations which means its debt is being efficiently utilised. This may mean this is an optimal capital structure for the business, given that it is also meeting its short-term commitment. This is only a rough assessment of financial health, and I’m sure CMC has company-specific issues impacting its capital structure decisions. You should continue to research Commercial Metals to get a better picture of the mid-cap by looking at:
Future Outlook: What are well-informed industry analysts predicting for CMC’s future growth? Take a look at our free research report of analyst consensus for CMC’s outlook.
Valuation: What is CMC worth today? Is the stock undervalued, even when its growth outlook is factored into its intrinsic value? The intrinsic value infographic in our free research report helps visualize whether CMC is currently mispriced by the market.
Other High-Performing Stocks: Are there other stocks that provide better prospects with proven track records? Explore our free list of these great stocks here.
To help readers see past the short term volatility of the financial market, we aim to bring you a long-term focused research analysis purely driven by fundamental data. Note that our analysis does not factor in the latest price-sensitive company announcements.
The author is an independent contributor and at the time of publication had no position in the stocks mentioned. For errors that warrant correction please contact the editor at editorial-team@simplywallst.com.
