
 Yahoo Finance
 Does CNX Resources Corporation's (NYSE:CNX) P/E Ratio Signal A Buying Opportunity?

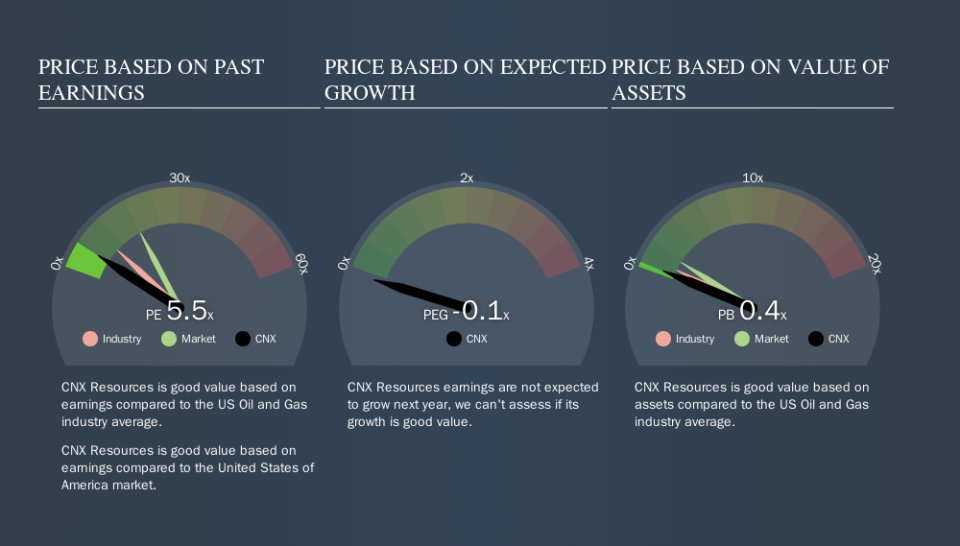
This article is written for those who want to get better at using price to earnings ratios (P/E ratios). We'll apply a basic P/E ratio analysis to CNX Resources Corporation's (NYSE:CNX), to help you decide if the stock is worth further research. What is CNX Resources's P/E ratio? Well, based on the last twelve months it is 5.51. That means that at current prices, buyers pay $5.51 for every $1 in trailing yearly profits.
See our latest analysis for CNX Resources
How Do I Calculate A Price To Earnings Ratio?
The formula for price to earnings is:
Price to Earnings Ratio = Price per Share ÷ Earnings per Share (EPS)
Or for CNX Resources:
P/E of 5.51 = $8.32 ÷ $1.51 (Based on the year to June 2019.)
Is A High P/E Ratio Good?
A higher P/E ratio means that investors are paying a higher price for each $1 of company earnings. That isn't necessarily good or bad, but a high P/E implies relatively high expectations of what a company can achieve in the future.
Does CNX Resources Have A Relatively High Or Low P/E For Its Industry?
One good way to get a quick read on what market participants expect of a company is to look at its P/E ratio. The image below shows that CNX Resources has a lower P/E than the average (9.7) P/E for companies in the oil and gas industry.
This suggests that market participants think CNX Resources will underperform other companies in its industry. Since the market seems unimpressed with CNX Resources, it's quite possible it could surprise on the upside. You should delve deeper. I like to check if company insiders have been buying or selling.
How Growth Rates Impact P/E Ratios
P/E ratios primarily reflect market expectations around earnings growth rates. Earnings growth means that in the future the 'E' will be higher. And in that case, the P/E ratio itself will drop rather quickly. And as that P/E ratio drops, the company will look cheap, unless its share price increases.
CNX Resources's earnings per share fell by 60% in the last twelve months. But it has grown its earnings per share by 15% per year over the last five years.
A Limitation: P/E Ratios Ignore Debt and Cash In The Bank
It's important to note that the P/E ratio considers the market capitalization, not the enterprise value. That means it doesn't take debt or cash into account. Hypothetically, a company could reduce its future P/E ratio by spending its cash (or taking on debt) to achieve higher earnings.
Spending on growth might be good or bad a few years later, but the point is that the P/E ratio does not account for the option (or lack thereof).
CNX Resources's Balance Sheet
CNX Resources has net debt worth a very significant 166% of its market capitalization. This is a relatively high level of debt, so the stock probably deserves a relatively low P/E ratio. Keep that in mind when comparing it to other companies.
The Verdict On CNX Resources's P/E Ratio
CNX Resources's P/E is 5.5 which is below average (18.2) in the US market. The P/E reflects market pessimism that probably arises from the lack of recent EPS growth, paired with significant leverage.
Investors have an opportunity when market expectations about a stock are wrong. If it is underestimating a company, investors can make money by buying and holding the shares until the market corrects itself. So this free visual report on analyst forecasts could hold the key to an excellent investment decision.
Of course you might be able to find a better stock than CNX Resources. So you may wish to see this free collection of other companies that have grown earnings strongly.
We aim to bring you long-term focused research analysis driven by fundamental data. Note that our analysis may not factor in the latest price-sensitive company announcements or qualitative material.
If you spot an error that warrants correction, please contact the editor at editorial-team@simplywallst.com. This article by Simply Wall St is general in nature. It does not constitute a recommendation to buy or sell any stock, and does not take account of your objectives, or your financial situation. Simply Wall St has no position in the stocks mentioned. Thank you for reading.
