
 Yahoo Finance
 What Does China Petroleum & Chemical Corporation's (HKG:386) P/E Ratio Tell You?

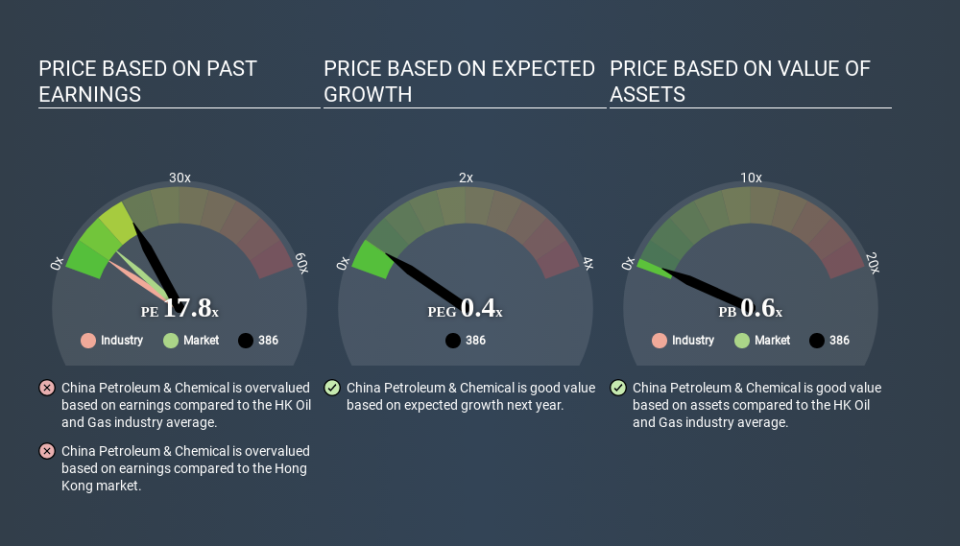
Today, we'll introduce the concept of the P/E ratio for those who are learning about investing. We'll look at China Petroleum & Chemical Corporation's (HKG:386) P/E ratio and reflect on what it tells us about the company's share price. Based on the last twelve months, China Petroleum & Chemical's P/E ratio is 17.79. That corresponds to an earnings yield of approximately 5.6%.
Check out our latest analysis for China Petroleum & Chemical
How Do I Calculate China Petroleum & Chemical's Price To Earnings Ratio?
The formula for P/E is:
Price to Earnings Ratio = Price per Share (in the reporting currency) ÷ Earnings per Share (EPS)
Or for China Petroleum & Chemical:
P/E of 17.79 = CN¥3.377 ÷ CN¥0.190 (Based on the year to March 2020.)
(Note: the above calculation uses the share price in the reporting currency, namely CNY and the calculation results may not be precise due to rounding.)
Is A High P/E Ratio Good?
The higher the P/E ratio, the higher the price tag of a business, relative to its trailing earnings. That is not a good or a bad thing per se, but a high P/E does imply buyers are optimistic about the future.
Does China Petroleum & Chemical Have A Relatively High Or Low P/E For Its Industry?
One good way to get a quick read on what market participants expect of a company is to look at its P/E ratio. As you can see below, China Petroleum & Chemical has a much higher P/E than the average company (5.9) in the oil and gas industry.
China Petroleum & Chemical's P/E tells us that market participants think the company will perform better than its industry peers, going forward. Shareholders are clearly optimistic, but the future is always uncertain. So further research is always essential. I often monitor director buying and selling.
How Growth Rates Impact P/E Ratios
When earnings fall, the 'E' decreases, over time. That means unless the share price falls, the P/E will increase in a few years. A higher P/E should indicate the stock is expensive relative to others -- and that may encourage shareholders to sell.
China Petroleum & Chemical saw earnings per share decrease by 61% last year. And over the longer term (5 years) earnings per share have decreased 8.3% annually. This growth rate might warrant a below average P/E ratio.
A Limitation: P/E Ratios Ignore Debt and Cash In The Bank
It's important to note that the P/E ratio considers the market capitalization, not the enterprise value. That means it doesn't take debt or cash into account. In theory, a company can lower its future P/E ratio by using cash or debt to invest in growth.
Such spending might be good or bad, overall, but the key point here is that you need to look at debt to understand the P/E ratio in context.
Is Debt Impacting China Petroleum & Chemical's P/E?
Net debt totals 18% of China Petroleum & Chemical's market cap. It would probably deserve a higher P/E ratio if it was net cash, since it would have more options for growth.
The Bottom Line On China Petroleum & Chemical's P/E Ratio
China Petroleum & Chemical's P/E is 17.8 which is above average (9.5) in its market. With some debt but no EPS growth last year, the market has high expectations of future profits.
When the market is wrong about a stock, it gives savvy investors an opportunity. As value investor Benjamin Graham famously said, 'In the short run, the market is a voting machine but in the long run, it is a weighing machine. So this free visualization of the analyst consensus on future earnings could help you make the right decision about whether to buy, sell, or hold.
Of course you might be able to find a better stock than China Petroleum & Chemical. So you may wish to see this free collection of other companies that have grown earnings strongly.
If you spot an error that warrants correction, please contact the editor at editorial-team@simplywallst.com. This article by Simply Wall St is general in nature. It does not constitute a recommendation to buy or sell any stock, and does not take account of your objectives, or your financial situation. Simply Wall St has no position in the stocks mentioned.
We aim to bring you long-term focused research analysis driven by fundamental data. Note that our analysis may not factor in the latest price-sensitive company announcements or qualitative material. Thank you for reading.
