
 Yahoo Finance
 Does CGI Inc. (TSE:GIB.A) Have A Good P/E Ratio?

Want to participate in a short research study? Help shape the future of investing tools and you could win a $250 gift card!
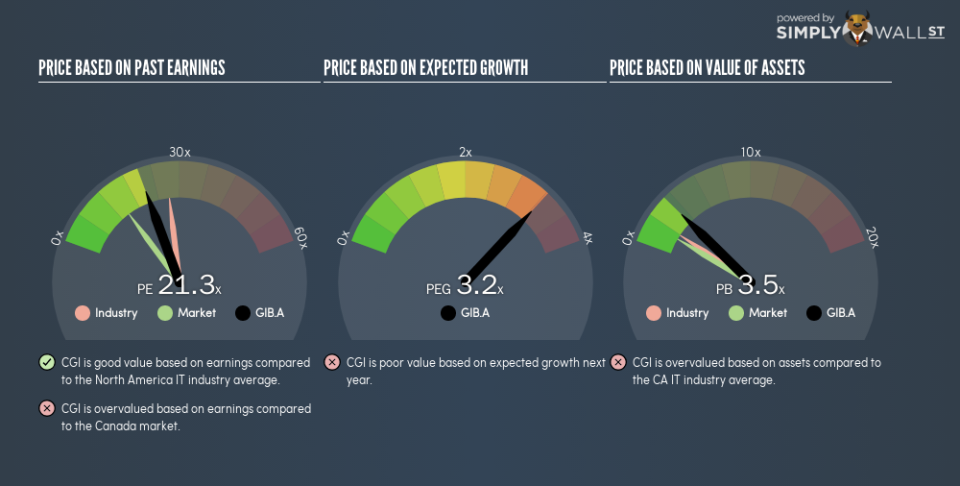
This article is written for those who want to get better at using price to earnings ratios (P/E ratios). We’ll look at CGI Inc.’s (TSE:GIB.A) P/E ratio and reflect on what it tells us about the company’s share price. Based on the last twelve months, CGI’s P/E ratio is 21.3. In other words, at today’s prices, investors are paying CA$21.3 for every CA$1 in prior year profit.
Check out our latest analysis for CGI
How Do You Calculate CGI’s P/E Ratio?
The formula for price to earnings is:
Price to Earnings Ratio = Price per Share ÷ Earnings per Share (EPS)
Or for CGI:
P/E of 21.3 = CA$88.37 ÷ CA$4.15 (Based on the trailing twelve months to December 2018.)
Is A High P/E Ratio Good?
A higher P/E ratio implies that investors pay a higher price for the earning power of the business. That is not a good or a bad thing per se, but a high P/E does imply buyers are optimistic about the future.
How Growth Rates Impact P/E Ratios
P/E ratios primarily reflect market expectations around earnings growth rates. Earnings growth means that in the future the ‘E’ will be higher. That means even if the current P/E is high, it will reduce over time if the share price stays flat. A lower P/E should indicate the stock is cheap relative to others — and that may attract buyers.
It’s great to see that CGI grew EPS by 17% in the last year. And its annual EPS growth rate over 5 years is 9.9%. So one might expect an above average P/E ratio.
How Does CGI’s P/E Ratio Compare To Its Peers?
We can get an indication of market expectations by looking at the P/E ratio. The image below shows that CGI has a lower P/E than the average (27.3) P/E for companies in the it industry.
CGI’s P/E tells us that market participants think it will not fare as well as its peers in the same industry. Many investors like to buy stocks when the market is pessimistic about their prospects. It is arguably worth checking if insiders are buying shares, because that might imply they believe the stock is undervalued.
Don’t Forget: The P/E Does Not Account For Debt or Bank Deposits
Don’t forget that the P/E ratio considers market capitalization. In other words, it does not consider any debt or cash that the company may have on the balance sheet. Theoretically, a business can improve its earnings (and produce a lower P/E in the future), by taking on debt (or spending its remaining cash).
Such spending might be good or bad, overall, but the key point here is that you need to look at debt to understand the P/E ratio in context.
How Does CGI’s Debt Impact Its P/E Ratio?
Net debt totals just 7.6% of CGI’s market cap. So it doesn’t have as many options as it would with net cash, but its debt would not have much of an impact on its P/E ratio.
The Bottom Line On CGI’s P/E Ratio
CGI’s P/E is 21.3 which is above average (14.4) in the CA market. While the company does use modest debt, its recent earnings growth is impressive. So it does not seem strange that the P/E is above average.
When the market is wrong about a stock, it gives savvy investors an opportunity. People often underestimate remarkable growth — so investors can make money when fast growth is not fully appreciated. So this free visual report on analyst forecasts could hold they key to an excellent investment decision.
Of course you might be able to find a better stock than CGI. So you may wish to see this free collection of other companies that have grown earnings strongly.
To help readers see past the short term volatility of the financial market, we aim to bring you a long-term focused research analysis purely driven by fundamental data. Note that our analysis does not factor in the latest price-sensitive company announcements.
The author is an independent contributor and at the time of publication had no position in the stocks mentioned. For errors that warrant correction please contact the editor at editorial-team@simplywallst.com.
