
 Yahoo Finance
 Does CenterPoint Energy, Inc.'s (NYSE:CNP) P/E Ratio Signal A Buying Opportunity?

This article is for investors who would like to improve their understanding of price to earnings ratios (P/E ratios). We'll show how you can use CenterPoint Energy, Inc.'s (NYSE:CNP) P/E ratio to inform your assessment of the investment opportunity. CenterPoint Energy has a P/E ratio of 16.05, based on the last twelve months. That means that at current prices, buyers pay $16.05 for every $1 in trailing yearly profits.
View our latest analysis for CenterPoint Energy
How Do You Calculate CenterPoint Energy's P/E Ratio?
The formula for price to earnings is:
Price to Earnings Ratio = Share Price ÷ Earnings per Share (EPS)
Or for CenterPoint Energy:
P/E of 16.05 = $21.550 ÷ $1.342 (Based on the trailing twelve months to December 2019.)
(Note: the above calculation results may not be precise due to rounding.)
Is A High Price-to-Earnings Ratio Good?
A higher P/E ratio means that investors are paying a higher price for each $1 of company earnings. That isn't necessarily good or bad, but a high P/E implies relatively high expectations of what a company can achieve in the future.
How Does CenterPoint Energy's P/E Ratio Compare To Its Peers?
We can get an indication of market expectations by looking at the P/E ratio. If you look at the image below, you can see CenterPoint Energy has a lower P/E than the average (21.5) in the integrated utilities industry classification.
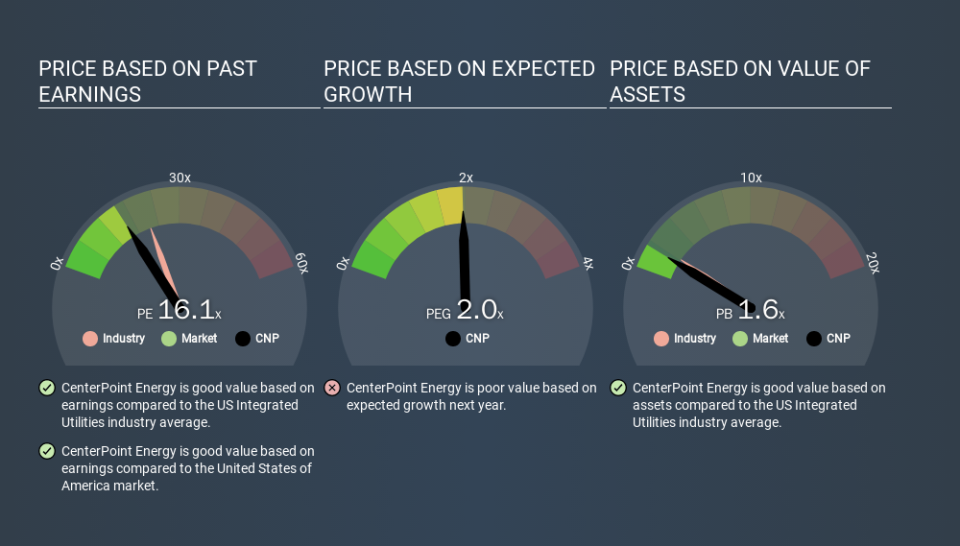
This suggests that market participants think CenterPoint Energy will underperform other companies in its industry. Since the market seems unimpressed with CenterPoint Energy, it's quite possible it could surprise on the upside. You should delve deeper. I like to check if company insiders have been buying or selling.
How Growth Rates Impact P/E Ratios
Probably the most important factor in determining what P/E a company trades on is the earnings growth. When earnings grow, the 'E' increases, over time. Therefore, even if you pay a high multiple of earnings now, that multiple will become lower in the future. So while a stock may look expensive based on past earnings, it could be cheap based on future earnings.
CenterPoint Energy's 81% EPS improvement over the last year was like bamboo growth after rain; rapid and impressive. Having said that, if we look back three years, EPS growth has averaged a comparatively less impressive 10%. Regrettably, the longer term performance is poor, with EPS down 1.1% per year over 5 years.
Remember: P/E Ratios Don't Consider The Balance Sheet
One drawback of using a P/E ratio is that it considers market capitalization, but not the balance sheet. So it won't reflect the advantage of cash, or disadvantage of debt. In theory, a company can lower its future P/E ratio by using cash or debt to invest in growth.
Such expenditure might be good or bad, in the long term, but the point here is that the balance sheet is not reflected by this ratio.
CenterPoint Energy's Balance Sheet
Net debt totals a substantial 130% of CenterPoint Energy's market cap. This level of debt justifies a relatively low P/E, so remain cognizant of the debt, if you're comparing it to other stocks.
The Bottom Line On CenterPoint Energy's P/E Ratio
CenterPoint Energy has a P/E of 16.1. That's around the same as the average in the US market, which is 16.2. It does have enough debt to add risk, although earnings growth was strong in the last year. The P/E suggests the market isn't confident that growth will be sustained, though.
Investors have an opportunity when market expectations about a stock are wrong. If the reality for a company is not as bad as the P/E ratio indicates, then the share price should increase as the market realizes this. So this free report on the analyst consensus forecasts could help you make a master move on this stock.
Of course you might be able to find a better stock than CenterPoint Energy. So you may wish to see this free collection of other companies that have grown earnings strongly.
If you spot an error that warrants correction, please contact the editor at editorial-team@simplywallst.com. This article by Simply Wall St is general in nature. It does not constitute a recommendation to buy or sell any stock, and does not take account of your objectives, or your financial situation. Simply Wall St has no position in the stocks mentioned.
We aim to bring you long-term focused research analysis driven by fundamental data. Note that our analysis may not factor in the latest price-sensitive company announcements or qualitative material. Thank you for reading.
