
 Yahoo Finance
 What Does Catalent, Inc.'s (NYSE:CTLT) P/E Ratio Tell You?

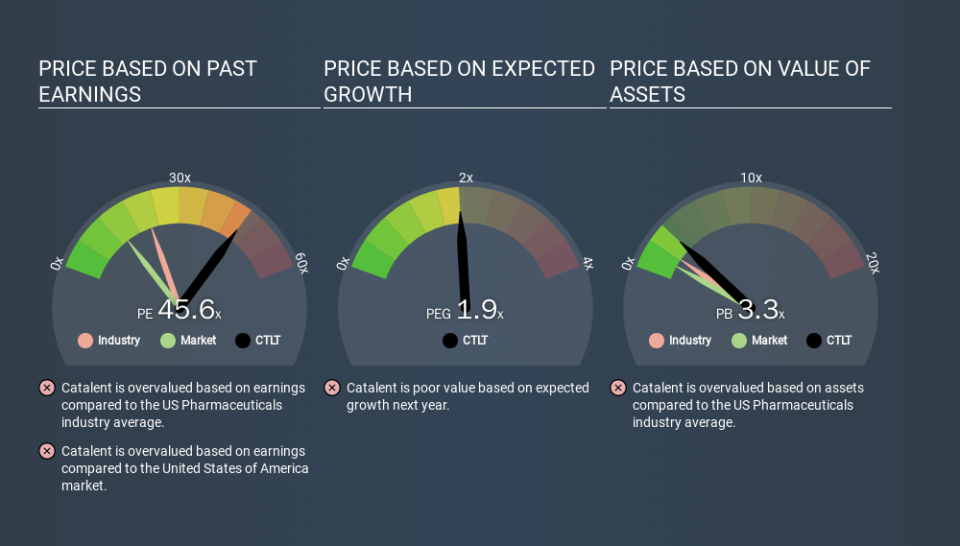
This article is written for those who want to get better at using price to earnings ratios (P/E ratios). To keep it practical, we'll show how Catalent, Inc.'s (NYSE:CTLT) P/E ratio could help you assess the value on offer. Catalent has a price to earnings ratio of 45.59, based on the last twelve months. In other words, at today's prices, investors are paying $45.59 for every $1 in prior year profit.
View our latest analysis for Catalent
How Do I Calculate A Price To Earnings Ratio?
The formula for P/E is:
Price to Earnings Ratio = Share Price ÷ Earnings per Share (EPS)
Or for Catalent:
P/E of 45.59 = $38.940 ÷ $0.854 (Based on the trailing twelve months to December 2019.)
(Note: the above calculation results may not be precise due to rounding.)
Is A High P/E Ratio Good?
A higher P/E ratio means that investors are paying a higher price for each $1 of company earnings. That isn't necessarily good or bad, but a high P/E implies relatively high expectations of what a company can achieve in the future.
Does Catalent Have A Relatively High Or Low P/E For Its Industry?
We can get an indication of market expectations by looking at the P/E ratio. As you can see below, Catalent has a higher P/E than the average company (18.5) in the pharmaceuticals industry.
Catalent's P/E tells us that market participants think the company will perform better than its industry peers, going forward. Shareholders are clearly optimistic, but the future is always uncertain. So investors should always consider the P/E ratio alongside other factors, such as whether company directors have been buying shares.
How Growth Rates Impact P/E Ratios
Earnings growth rates have a big influence on P/E ratios. When earnings grow, the 'E' increases, over time. Therefore, even if you pay a high multiple of earnings now, that multiple will become lower in the future. A lower P/E should indicate the stock is cheap relative to others -- and that may attract buyers.
Catalent's earnings per share fell by 13% in the last twelve months. But it has grown its earnings per share by 5.4% per year over the last five years.
A Limitation: P/E Ratios Ignore Debt and Cash In The Bank
One drawback of using a P/E ratio is that it considers market capitalization, but not the balance sheet. Thus, the metric does not reflect cash or debt held by the company. The exact same company would hypothetically deserve a higher P/E ratio if it had a strong balance sheet, than if it had a weak one with lots of debt, because a cashed up company can spend on growth.
Such expenditure might be good or bad, in the long term, but the point here is that the balance sheet is not reflected by this ratio.
How Does Catalent's Debt Impact Its P/E Ratio?
Catalent's net debt equates to 42% of its market capitalization. While it's worth keeping this in mind, it isn't a worry.
The Verdict On Catalent's P/E Ratio
Catalent has a P/E of 45.6. That's significantly higher than the average in its market, which is 12.7. With modest debt but no EPS growth in the last year, it's fair to say the P/E implies some optimism about future earnings, from the market.
Investors have an opportunity when market expectations about a stock are wrong. As value investor Benjamin Graham famously said, 'In the short run, the market is a voting machine but in the long run, it is a weighing machine. So this free visualization of the analyst consensus on future earnings could help you make the right decision about whether to buy, sell, or hold.
Of course, you might find a fantastic investment by looking at a few good candidates. So take a peek at this free list of companies with modest (or no) debt, trading on a P/E below 20.
If you spot an error that warrants correction, please contact the editor at editorial-team@simplywallst.com. This article by Simply Wall St is general in nature. It does not constitute a recommendation to buy or sell any stock, and does not take account of your objectives, or your financial situation. Simply Wall St has no position in the stocks mentioned.
We aim to bring you long-term focused research analysis driven by fundamental data. Note that our analysis may not factor in the latest price-sensitive company announcements or qualitative material. Thank you for reading.
