
 Yahoo Finance
 How Does AXMIN's (CVE:AXM) P/E Compare To Its Industry, After The Share Price Drop?

To the annoyance of some shareholders, AXMIN (CVE:AXM) shares are down a considerable 34% in the last month. Looking back further, the stock is up 3.8% in the last year.
Assuming nothing else has changed, a lower share price makes a stock more attractive to potential buyers. In the long term, share prices tend to follow earnings per share, but in the short term prices bounce around in response to short term factors (which are not always obvious). So, on certain occasions, long term focussed investors try to take advantage of pessimistic expectations to buy shares at a better price. One way to gauge market expectations of a stock is to look at its Price to Earnings Ratio (PE Ratio). Investors have optimistic expectations of companies with higher P/E ratios, compared to companies with lower P/E ratios.
See our latest analysis for AXMIN
Does AXMIN Have A Relatively High Or Low P/E For Its Industry?
We can tell from its P/E ratio of 42.99 that there is some investor optimism about AXMIN. The image below shows that AXMIN has a significantly higher P/E than the average (13.7) P/E for companies in the metals and mining industry.
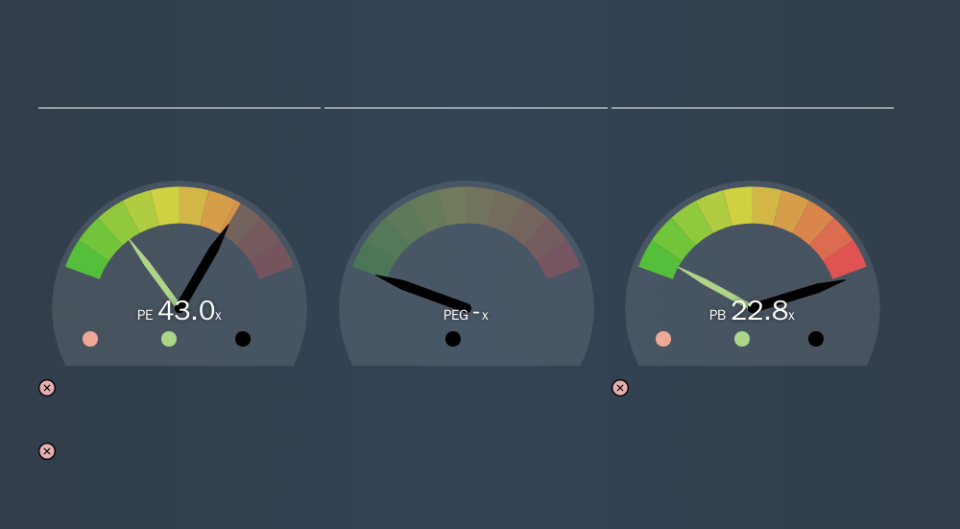
AXMIN's P/E tells us that market participants think the company will perform better than its industry peers, going forward. The market is optimistic about the future, but that doesn't guarantee future growth. So investors should always consider the P/E ratio alongside other factors, such as whether company directors have been buying shares.
How Growth Rates Impact P/E Ratios
Probably the most important factor in determining what P/E a company trades on is the earnings growth. Earnings growth means that in the future the 'E' will be higher. That means unless the share price increases, the P/E will reduce in a few years. And as that P/E ratio drops, the company will look cheap, unless its share price increases.
AXMIN shrunk earnings per share by 57% over the last year.
A Limitation: P/E Ratios Ignore Debt and Cash In The Bank
The 'Price' in P/E reflects the market capitalization of the company. In other words, it does not consider any debt or cash that the company may have on the balance sheet. The exact same company would hypothetically deserve a higher P/E ratio if it had a strong balance sheet, than if it had a weak one with lots of debt, because a cashed up company can spend on growth.
While growth expenditure doesn't always pay off, the point is that it is a good option to have; but one that the P/E ratio ignores.
So What Does AXMIN's Balance Sheet Tell Us?
AXMIN has net cash of US$1.5m. That should lead to a higher P/E than if it did have debt, because its strong balance sheets gives it more options.
The Verdict On AXMIN's P/E Ratio
AXMIN trades on a P/E ratio of 43.0, which is above its market average of 14.5. Falling earnings per share is probably keeping traditional value investors away, but the healthy balance sheet means the company retains potential for future growth. If fails to eventuate, the current high P/E could prove to be temporary, as the share price falls. What can be absolutely certain is that the market has become significantly less optimistic about AXMIN over the last month, with the P/E ratio falling from 64.9 back then to 43.0 today. For those who don't like to trade against momentum, that could be a warning sign, but a contrarian investor might want to take a closer look.
Investors have an opportunity when market expectations about a stock are wrong. If the reality for a company is better than it expects, you can make money by buying and holding for the long term. We don't have analyst forecasts, but shareholders might want to examine this detailed historical graph of earnings, revenue and cash flow.
Of course you might be able to find a better stock than AXMIN. So you may wish to see this free collection of other companies that have grown earnings strongly.
We aim to bring you long-term focused research analysis driven by fundamental data. Note that our analysis may not factor in the latest price-sensitive company announcements or qualitative material.
If you spot an error that warrants correction, please contact the editor at editorial-team@simplywallst.com. This article by Simply Wall St is general in nature. It does not constitute a recommendation to buy or sell any stock, and does not take account of your objectives, or your financial situation. Simply Wall St has no position in the stocks mentioned. Thank you for reading.
