
 Yahoo Finance
 Does Ardagh Group's (NYSE:ARD) Share Price Gain of 16% Match Its Business Performance?

If you want to compound wealth in the stock market, you can do so by buying an index fund. But if you pick the right individual stocks, you could make more than that. To wit, the Ardagh Group S.A. (NYSE:ARD) share price is 16% higher than it was a year ago, much better than the market return of around 6.8% (not including dividends) in the same period. If it can keep that out-performance up over the long term, investors will do very well! Ardagh Group hasn't been listed for long, so it's still not clear if it is a long term winner.
View our latest analysis for Ardagh Group
While the efficient markets hypothesis continues to be taught by some, it has been proven that markets are over-reactive dynamic systems, and investors are not always rational. One imperfect but simple way to consider how the market perception of a company has shifted is to compare the change in the earnings per share (EPS) with the share price movement.
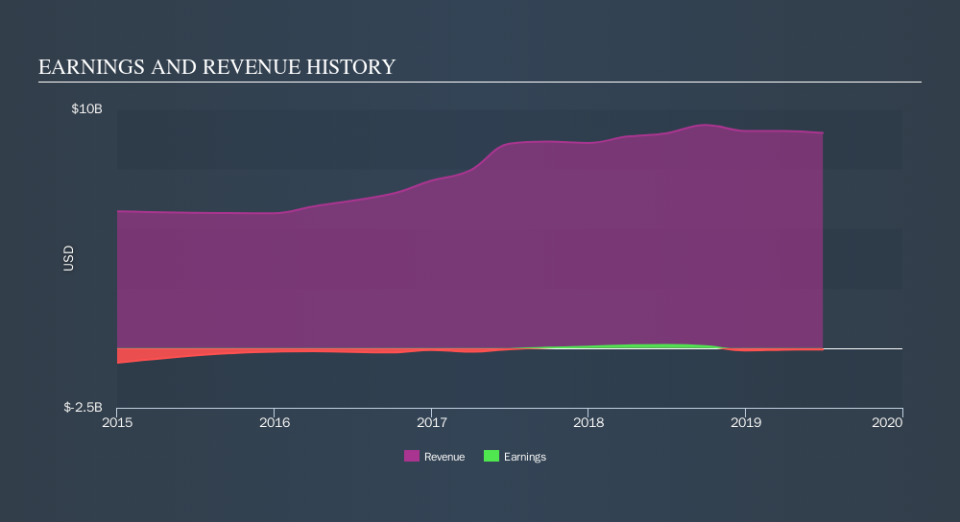
Over the last twelve months Ardagh Group went from profitable to unprofitable. While this may prove temporary, we'd consider it a negative, so we would not have expected to see the share price up. It may be that the company has done well on other metrics.
Revenue was pretty stable on last year, so deeper research might be needed to explain the share price rise.
You can see below how earnings and revenue have changed over time (discover the exact values by clicking on the image).
Take a more thorough look at Ardagh Group's financial health with this free report on its balance sheet.
What About Dividends?
As well as measuring the share price return, investors should also consider the total shareholder return (TSR). The TSR is a return calculation that accounts for the value of cash dividends (assuming that any dividend received was reinvested) and the calculated value of any discounted capital raisings and spin-offs. It's fair to say that the TSR gives a more complete picture for stocks that pay a dividend. As it happens, Ardagh Group's TSR for the last year was 21%, which exceeds the share price return mentioned earlier. The dividends paid by the company have thusly boosted the total shareholder return.
A Different Perspective
It's nice to see that Ardagh Group shareholders have gained 21% over the last year , including dividends . That's better than the more recent three month gain of 0.3%, implying that share price has plateaued recently. Having said that, we doubt shareholders would be concerned. It seems the market is simply waiting on more information, because if the business delivers so will the share price (eventually). Keeping this in mind, a solid next step might be to take a look at Ardagh Group's dividend track record. This free interactive graph is a great place to start.
If you like to buy stocks alongside management, then you might just love this free list of companies. (Hint: insiders have been buying them).
Please note, the market returns quoted in this article reflect the market weighted average returns of stocks that currently trade on US exchanges.
We aim to bring you long-term focused research analysis driven by fundamental data. Note that our analysis may not factor in the latest price-sensitive company announcements or qualitative material.
If you spot an error that warrants correction, please contact the editor at editorial-team@simplywallst.com. This article by Simply Wall St is general in nature. It does not constitute a recommendation to buy or sell any stock, and does not take account of your objectives, or your financial situation. Simply Wall St has no position in the stocks mentioned. Thank you for reading.