
 Yahoo Finance
 Does Agnico Eagle Mines Limited’s (NYSE:AEM) PE Ratio Signal A Selling Opportunity?

I am writing today to help inform people who are new to the stock market and want to learn about the link between company’s fundamentals and stock market performance.
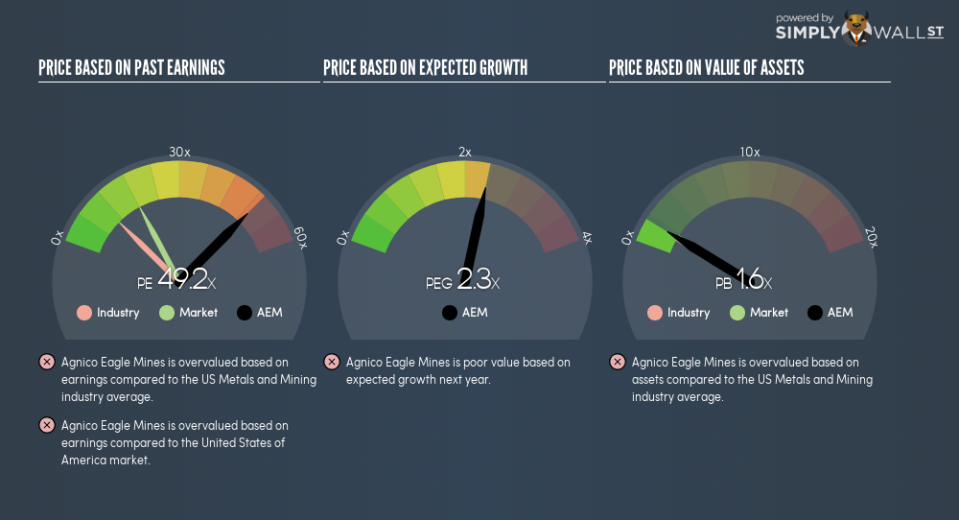
Agnico Eagle Mines Limited (NYSE:AEM) is trading with a trailing P/E of 49.2x, which is higher than the industry average of 10.5x. While AEM might seem like a stock to avoid or sell if you own it, it is important to understand the assumptions behind the P/E ratio before you make any investment decisions. Today, I will deconstruct the P/E ratio and highlight what you need to be careful of when using the P/E ratio.
View our latest analysis for Agnico Eagle Mines
What you need to know about the P/E ratio
The P/E ratio is one of many ratios used in relative valuation. By comparing a stock’s price per share to its earnings per share, we are able to see how much investors are paying for each dollar of the company’s earnings.
P/E Calculation for AEM
Price-Earnings Ratio = Price per share ÷ Earnings per share
AEM Price-Earnings Ratio = $34.55 ÷ $0.702 = 49.2x
On its own, the P/E ratio doesn’t tell you much; however, it becomes extremely useful when you compare it with other similar companies. We preferably want to compare the stock’s P/E ratio to the average of companies that have similar features to AEM, such as capital structure and profitability. A quick method of creating a peer group is to use companies in the same industry, which is what I will do. Since AEM’s P/E of 49.2x is higher than its industry peers (10.5x), it means that investors are paying more than they should for each dollar of AEM’s earnings. This multiple is a median of profitable companies of 25 Metals and Mining companies in US including North American Potash Developments, Sherritt International and Société d’Exploration Minière Vior. Therefore, according to this analysis, AEM is an over-priced stock.
Assumptions to watch out for
Before you jump to the conclusion that AEM should be banished from your portfolio, it is important to realise that our conclusion rests on two assertions. The first is that our “similar companies” are actually similar to AEM, or else the difference in P/E might be a result of other factors. For example, if you compared higher growth firms with AEM, then its P/E would naturally be lower since investors would reward its peers’ higher growth with a higher price. The second assumption that must hold true is that the stocks we are comparing AEM to are fairly valued by the market. If this does not hold, there is a possibility that AEM’s P/E is lower because our peer group is overvalued by the market.
What this means for you:
You may have already conducted fundamental analysis on the stock as a shareholder, so its current overvaluation could signal a potential selling opportunity to reduce your exposure to AEM. Now that you understand the ins and outs of the PE metric, you should know to bear in mind its limitations before you make an investment decision. Remember that basing your investment decision off one metric alone is certainly not sufficient. There are many things I have not taken into account in this article and the PE ratio is very one-dimensional. If you have not done so already, I urge you to complete your research by taking a look at the following:
Future Outlook: What are well-informed industry analysts predicting for AEM’s future growth? Take a look at our free research report of analyst consensus for AEM’s outlook.
Past Track Record: Has AEM been consistently performing well irrespective of the ups and downs in the market? Go into more detail in the past performance analysis and take a look at the free visual representations of AEM’s historicals for more clarity.
Other High-Performing Stocks: Are there other stocks that provide better prospects with proven track records? Explore our free list of these great stocks here.
To help readers see past the short term volatility of the financial market, we aim to bring you a long-term focused research analysis purely driven by fundamental data. Note that our analysis does not factor in the latest price-sensitive company announcements.
The author is an independent contributor and at the time of publication had no position in the stocks mentioned. For errors that warrant correction please contact the editor at editorial-team@simplywallst.com.
