
 Yahoo Finance
 Are Dividend Investors Making A Mistake With Computer Modelling Group Ltd. (TSE:CMG)?

Today we'll take a closer look at Computer Modelling Group Ltd. (TSE:CMG) from a dividend investor's perspective. Owning a strong business and reinvesting the dividends is widely seen as an attractive way of growing your wealth. On the other hand, investors have been known to buy a stock because of its yield, and then lose money if the company's dividend doesn't live up to expectations.
In this case, Computer Modelling Group likely looks attractive to investors, given its 4.9% dividend yield and a payment history of over ten years. We'd guess that plenty of investors have purchased it for the income. Remember though, due to the recent spike in its share price, Computer Modelling Group's yield will look lower, even though the market may now be factoring in an improvement in its long-term prospects. Some simple analysis can offer a lot of insights when buying a company for its dividend, and we'll go through this below.
Explore this interactive chart for our latest analysis on Computer Modelling Group!
Payout ratios
Companies (usually) pay dividends out of their earnings. If a company is paying more than it earns, the dividend might have to be cut. So we need to form a view on if a company's dividend is sustainable, relative to its net profit after tax. Computer Modelling Group paid out 133% of its profit as dividends, over the trailing twelve month period. A payout ratio above 100% is definitely an item of concern, unless there are some other circumstances that would justify it.
In addition to comparing dividends against profits, we should inspect whether the company generated enough cash to pay its dividend. Computer Modelling Group paid out 117% of its free cash last year. Cash flows can be lumpy, but this dividend was not well covered by cash flow. As Computer Modelling Group's dividend was not well covered by either earnings or cash flow, we would be concerned that this dividend could be at risk over the long term.
While the above analysis focuses on dividends relative to a company's earnings, we do note Computer Modelling Group's strong net cash position, which will let it pay larger dividends for a time, should it choose.
We update our data on Computer Modelling Group every 24 hours, so you can always get our latest analysis of its financial health, here.
Dividend Volatility
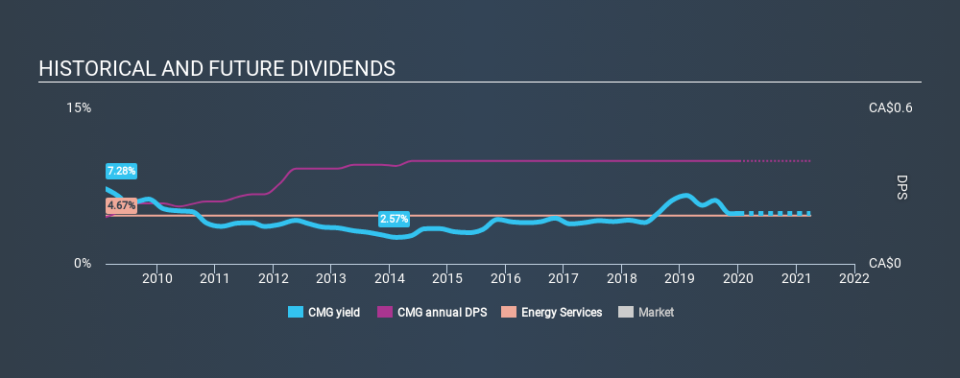
From the perspective of an income investor who wants to earn dividends for many years, there is not much point buying a stock if its dividend is regularly cut or is not reliable. For the purpose of this article, we only scrutinise the last decade of Computer Modelling Group's dividend payments. Its dividend payments have fallen by 20% or more on at least one occasion over the past ten years. During the past ten-year period, the first annual payment was CA$0.18 in 2010, compared to CA$0.40 last year. Dividends per share have grown at approximately 8.2% per year over this time. The dividends haven't grown at precisely 8.2% every year, but this is a useful way to average out the historical rate of growth.
A reasonable rate of dividend growth is good to see, but we're wary that the dividend history is not as solid as we'd like, having been cut at least once.
Dividend Growth Potential
With a relatively unstable dividend, it's even more important to evaluate if earnings per share (EPS) are growing - it's not worth taking the risk on a dividend getting cut, unless you might be rewarded with larger dividends in future. Over the past five years, it looks as though Computer Modelling Group's EPS have declined at around 3.4% a year. A modest decline in earnings per share is not great to see, but it doesn't automatically make a dividend unsustainable. Still, we'd vastly prefer to see EPS growth when researching dividend stocks.
Conclusion
When we look at a dividend stock, we need to form a judgement on whether the dividend will grow, if the company is able to maintain it in a wide range of economic circumstances, and if the dividend payout is sustainable. It's a concern to see that the company paid out such a high percentage of its earnings and cashflow as dividends. Earnings per share have been falling, and the company has cut its dividend at least once in the past. From a dividend perspective, this is a cause for concern. In this analysis, Computer Modelling Group doesn't shape up too well as a dividend stock. We'd find it hard to look past the flaws, and would not be inclined to think of it as a reliable dividend-payer.
Given that earnings are not growing, the dividend does not look nearly so attractive. Very few businesses see earnings consistently shrink year after year in perpetuity though, and so it might be worth seeing what the 6 analysts we track are forecasting for the future.
If you are a dividend investor, you might also want to look at our curated list of dividend stocks yielding above 3%.
If you spot an error that warrants correction, please contact the editor at editorial-team@simplywallst.com. This article by Simply Wall St is general in nature. It does not constitute a recommendation to buy or sell any stock, and does not take account of your objectives, or your financial situation. Simply Wall St has no position in the stocks mentioned.
We aim to bring you long-term focused research analysis driven by fundamental data. Note that our analysis may not factor in the latest price-sensitive company announcements or qualitative material. Thank you for reading.
