
 Yahoo Finance
 Diverging Natural Gas Producers and Futures-Based ETFs
Natural gas futures plunged Friday, dipping to their lowest in over a year. Meanwhile, natural gas stock exchange traded funds are surging along with the broader U.S. markets.
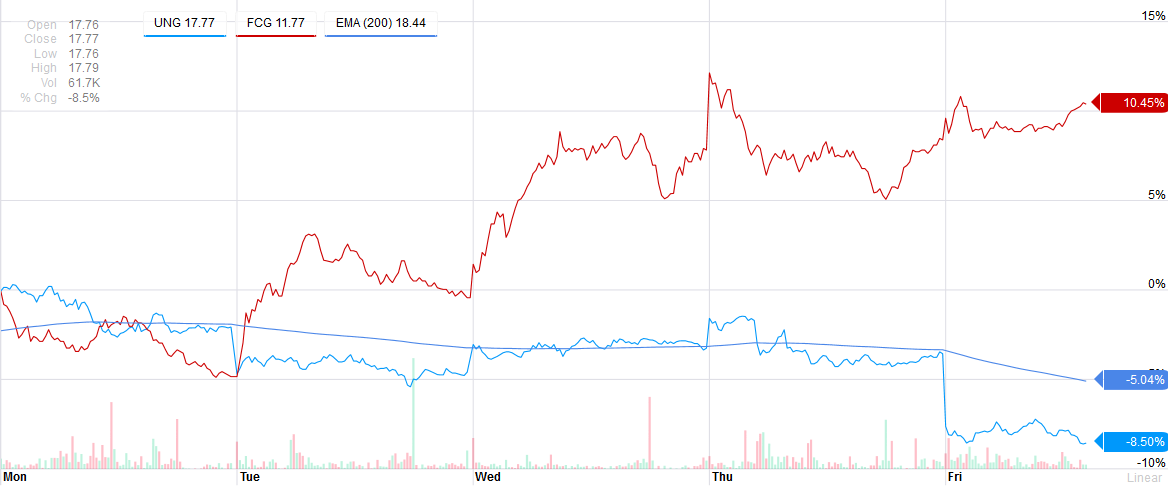
The United States Natural Gas Fund (UNG) fell 5.1% Friday. In the past five trading sessions, UNG declined 8.5%, whereas the First Trust ISE-Revere Natural Gas Index Fund (FCG) , which is comprised of natural gas exploration and production companies, gained 10.5%.
Additionally, the Direxion Daily Natural Gas Related Bull 3X (GASL) , which takes the 3x or 300% daily performance of the ISE Revere Natural Gas Index, has also jumped 33.6% over the past five sessions.
Nevertheless, natural gas-related assets are still in the negative this year. Year-to-date, UNG decreased 9.4%, FCG plunged 40.5% and GASL plummeted 84.9%. [10 Worst Leveraged ETFs of 2014]
The rally in energy stocks suggests that investors have been jumping on cheap natural gas producers in the wake of the severe sell-off in anything oil related as crude prices dropped to five-year lows. For instance, FCG is trading at a 14.5 price-to-earnings ratio and a 1.1 price-to-book. In contrast, the S&P 500 index shows a 17.6 P/E and a 2.4 P/B. [Diverging Energy Sector and Oil Futures ETFs]
Meanwhile, NYMEX natural gas futures declined 4.1% Friday to $3.5 per million British thermal units, and it appears that high production could keep prices suppressed.
Despite the rising winter heating needs, the boom in energy production from new shale drilling techniques has helped replenish supplies, causing withdrawals to fall below average for this time of the year, reports Christian Berthelsen for the Wall Street Journal.
The U.S. Energy Information Administration revealed that total domestic inventories rose year-over-year for the first time in nearly a year and was 7.3% below average, which some warn could lessen in the coming weeks due to a mild December.
“Stymied demand and record production continue to pressure prices lower,” research consultancy Schneider Electric analyst Matt Smith said in a note.
Source: Yahoo! Finance
For more information on the natural gas market, visit our natural gas category.
