
 Yahoo Finance
 Do Directors Own Corus Entertainment Inc. (TSE:CJR.B) Shares?

If you want to know who really controls Corus Entertainment Inc. (TSE:CJR.B), then you'll have to look at the makeup of its share registry. Institutions will often hold stock in bigger companies, and we expect to see insiders owning a noticeable percentage of the smaller ones. Companies that used to be publicly owned tend to have lower insider ownership.
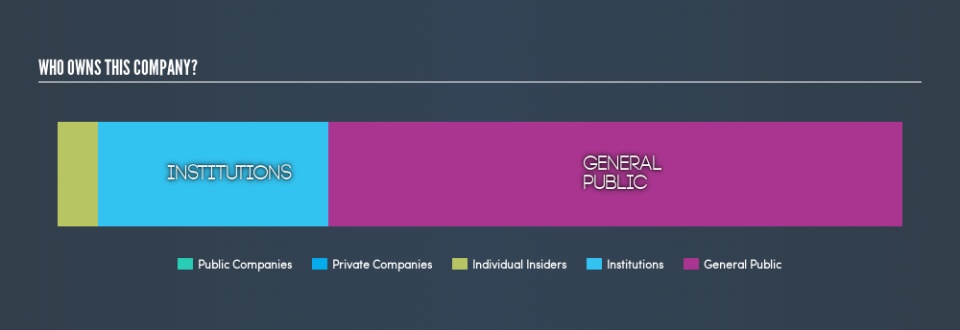
Corus Entertainment has a market capitalization of CA$1.1b, so we would expect some institutional investors to have noticed the stock. In the chart below below, we can see that institutions own shares in the company. Let's delve deeper into each type of owner, to discover more about CJR.B.
Check out our latest analysis for Corus Entertainment
What Does The Institutional Ownership Tell Us About Corus Entertainment?
Institutions typically measure themselves against a benchmark when reporting to their own investors, so they often become more enthusiastic about a stock once it's included in a major index. We would expect most companies to have some institutions on the register, especially if they are growing.
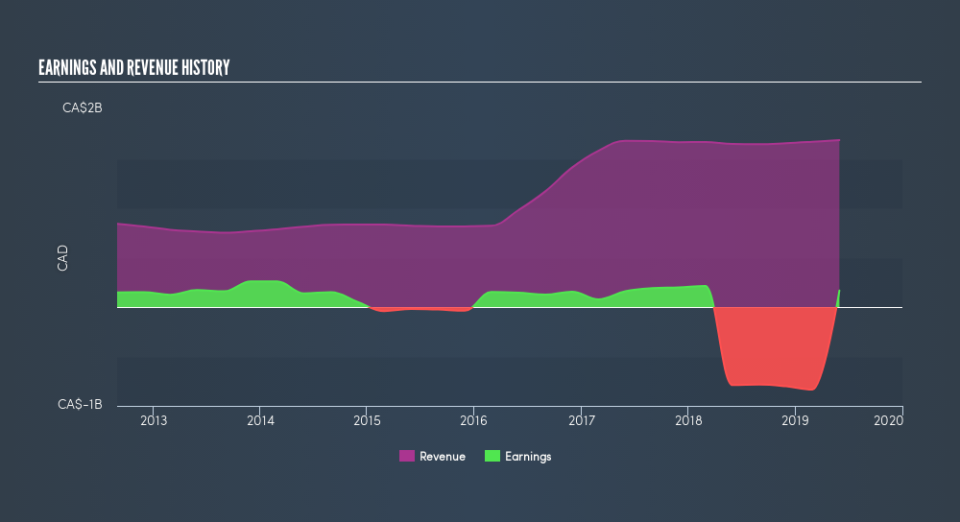
We can see that Corus Entertainment does have institutional investors; and they hold 27% of the stock. This suggests some credibility amongst professional investors. But we can't rely on that fact alone, since institutions make bad investments sometimes, just like everyone does. If multiple institutions change their view on a stock at the same time, you could see the share price drop fast. It's therefore worth looking at Corus Entertainment's earnings history, below. Of course, the future is what really matters.
We note that hedge funds don't have a meaningful investment in Corus Entertainment. There are a reasonable number of analysts covering the stock, so it might be useful to find out their aggregate view on the future.
Insider Ownership Of Corus Entertainment
The definition of an insider can differ slightly between different countries, but members of the board of directors always count. Management ultimately answers to the board. However, it is not uncommon for managers to be executive board members, especially if they are a founder or the CEO.
Most consider insider ownership a positive because it can indicate the board is well aligned with other shareholders. However, on some occasions too much power is concentrated within this group.
Shareholders would probably be interested to learn that insiders own shares in Corus Entertainment Inc.. As individuals, the insiders collectively own CA$53m worth of the CA$1.1b company. This shows at least some alignment. You can click here to see if those insiders have been buying or selling.
General Public Ownership
The general public -- mostly retail investors -- own 68% of Corus Entertainment . This level of ownership gives retail investors the power to sway key policy decisions such as board composition, executive compensation, and the dividend payout ratio.
Next Steps:
While it is well worth considering the different groups that own a company, there are other factors that are even more important.
Many find it useful to take an in depth look at how a company has performed in the past. You can access this detailed graph of past earnings, revenue and cash flow .
If you would prefer discover what analysts are predicting in terms of future growth, do not miss this free report on analyst forecasts.
NB: Figures in this article are calculated using data from the last twelve months, which refer to the 12-month period ending on the last date of the month the financial statement is dated. This may not be consistent with full year annual report figures.
We aim to bring you long-term focused research analysis driven by fundamental data. Note that our analysis may not factor in the latest price-sensitive company announcements or qualitative material.
If you spot an error that warrants correction, please contact the editor at editorial-team@simplywallst.com. This article by Simply Wall St is general in nature. It does not constitute a recommendation to buy or sell any stock, and does not take account of your objectives, or your financial situation. Simply Wall St has no position in the stocks mentioned. Thank you for reading.