
 Yahoo Finance
 Did The Underlying Business Drive Constellation Software's (TSE:CSU) Lovely 327% Share Price Gain?

Buying shares in the best businesses can build meaningful wealth for you and your family. And we've seen some truly amazing gains over the years. To wit, the Constellation Software Inc. (TSE:CSU) share price has soared 327% over five years. If that doesn't get you thinking about long term investing, we don't know what will. It's down 3.6% in the last seven days.
View our latest analysis for Constellation Software
There is no denying that markets are sometimes efficient, but prices do not always reflect underlying business performance. One imperfect but simple way to consider how the market perception of a company has shifted is to compare the change in the earnings per share (EPS) with the share price movement.
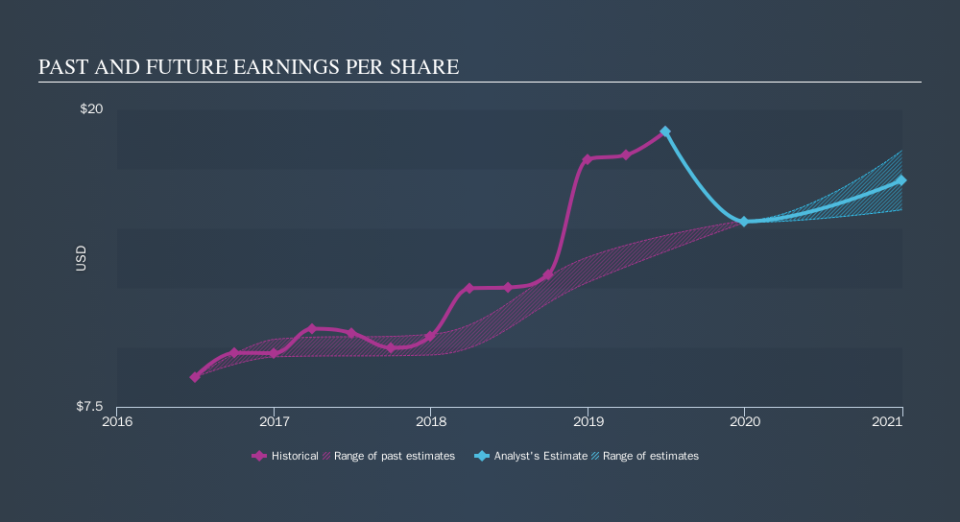
Over half a decade, Constellation Software managed to grow its earnings per share at 33% a year. This EPS growth is remarkably close to the 34% average annual increase in the share price. This indicates that investor sentiment towards the company has not changed a great deal. Rather, the share price has approximately tracked EPS growth.
You can see below how EPS has changed over time (discover the exact values by clicking on the image).
We like that insiders have been buying shares in the last twelve months. Having said that, most people consider earnings and revenue growth trends to be a more meaningful guide to the business. Before buying or selling a stock, we always recommend a close examination of historic growth trends, available here..
What About Dividends?
When looking at investment returns, it is important to consider the difference between total shareholder return (TSR) and share price return. The TSR incorporates the value of any spin-offs or discounted capital raisings, along with any dividends, based on the assumption that the dividends are reinvested. It's fair to say that the TSR gives a more complete picture for stocks that pay a dividend. As it happens, Constellation Software's TSR for the last 5 years was 355%, which exceeds the share price return mentioned earlier. And there's no prize for guessing that the dividend payments largely explain the divergence!
A Different Perspective
We're pleased to report that Constellation Software shareholders have received a total shareholder return of 51% over one year. That's including the dividend. That gain is better than the annual TSR over five years, which is 35%. Therefore it seems like sentiment around the company has been positive lately. Given the share price momentum remains strong, it might be worth taking a closer look at the stock, lest you miss an opportunity. It is all well and good that insiders have been buying shares, but we suggest you check here to see what price insiders were buying at.
Constellation Software is not the only stock insiders are buying. So take a peek at this free list of growing companies with insider buying.
Please note, the market returns quoted in this article reflect the market weighted average returns of stocks that currently trade on CA exchanges.
We aim to bring you long-term focused research analysis driven by fundamental data. Note that our analysis may not factor in the latest price-sensitive company announcements or qualitative material.
If you spot an error that warrants correction, please contact the editor at editorial-team@simplywallst.com. This article by Simply Wall St is general in nature. It does not constitute a recommendation to buy or sell any stock, and does not take account of your objectives, or your financial situation. Simply Wall St has no position in the stocks mentioned. Thank you for reading.