
 Yahoo Finance
 Did Silgan Holdings Inc. (NYSE:SLGN) Use Debt To Deliver Its ROE Of 16%?
One of the best investments we can make is in our own knowledge and skill set. With that in mind, this article will work through how we can use Return On Equity (ROE) to better understand a business. By way of learning-by-doing, we'll look at ROE to gain a better understanding of Silgan Holdings Inc. (NYSE:SLGN).
Return on equity or ROE is a key measure used to assess how efficiently a company's management is utilizing the company's capital. In other words, it is a profitability ratio which measures the rate of return on the capital provided by the company's shareholders.
Check out our latest analysis for Silgan Holdings
How Do You Calculate Return On Equity?
ROE can be calculated by using the formula:
Return on Equity = Net Profit (from continuing operations) ÷ Shareholders' Equity
So, based on the above formula, the ROE for Silgan Holdings is:
16% = US$309m ÷ US$1.9b (Based on the trailing twelve months to March 2024).
The 'return' is the amount earned after tax over the last twelve months. So, this means that for every $1 of its shareholder's investments, the company generates a profit of $0.16.
Does Silgan Holdings Have A Good ROE?
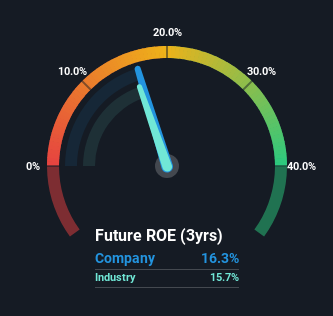
One simple way to determine if a company has a good return on equity is to compare it to the average for its industry. However, this method is only useful as a rough check, because companies do differ quite a bit within the same industry classification. You can see in the graphic below that Silgan Holdings has an ROE that is fairly close to the average for the Packaging industry (16%).
So while the ROE is not exceptional, at least its acceptable. While at least the ROE is not lower than the industry, its still worth checking what role the company's debt plays as high debt levels relative to equity may also make the ROE appear high. If true, then it is more an indication of risk than the potential. To know the 2 risks we have identified for Silgan Holdings visit our risks dashboard for free.
How Does Debt Impact Return On Equity?
Most companies need money -- from somewhere -- to grow their profits. That cash can come from issuing shares, retained earnings, or debt. In the case of the first and second options, the ROE will reflect this use of cash, for growth. In the latter case, the debt used for growth will improve returns, but won't affect the total equity. That will make the ROE look better than if no debt was used.
Silgan Holdings' Debt And Its 16% ROE
It's worth noting the high use of debt by Silgan Holdings, leading to its debt to equity ratio of 2.01. There's no doubt its ROE is decent, but the very high debt the company carries is not too exciting to see. Investors should think carefully about how a company might perform if it was unable to borrow so easily, because credit markets do change over time.
Conclusion
Return on equity is useful for comparing the quality of different businesses. A company that can achieve a high return on equity without debt could be considered a high quality business. All else being equal, a higher ROE is better.
But ROE is just one piece of a bigger puzzle, since high quality businesses often trade on high multiples of earnings. Profit growth rates, versus the expectations reflected in the price of the stock, are a particularly important to consider. So I think it may be worth checking this free report on analyst forecasts for the company.
If you would prefer check out another company -- one with potentially superior financials -- then do not miss this free list of interesting companies, that have HIGH return on equity and low debt.
Have feedback on this article? Concerned about the content? Get in touch with us directly. Alternatively, email editorial-team (at) simplywallst.com.
This article by Simply Wall St is general in nature. We provide commentary based on historical data and analyst forecasts only using an unbiased methodology and our articles are not intended to be financial advice. It does not constitute a recommendation to buy or sell any stock, and does not take account of your objectives, or your financial situation. We aim to bring you long-term focused analysis driven by fundamental data. Note that our analysis may not factor in the latest price-sensitive company announcements or qualitative material. Simply Wall St has no position in any stocks mentioned.
Have feedback on this article? Concerned about the content? Get in touch with us directly. Alternatively, email editorial-team@simplywallst.com