
 Yahoo Finance
 Did You Participate In Any Of W.W. Grainger's (NYSE:GWW) Fantastic 125% Return ?
The most you can lose on any stock (assuming you don't use leverage) is 100% of your money. But on a lighter note, a good company can see its share price rise well over 100%. For example, the W.W. Grainger, Inc. (NYSE:GWW) share price has soared 103% in the last half decade. Most would be very happy with that. On top of that, the share price is up 16% in about a quarter. But this move may well have been assisted by the reasonably buoyant market (up 9.2% in 90 days).
View our latest analysis for W.W. Grainger
There is no denying that markets are sometimes efficient, but prices do not always reflect underlying business performance. One flawed but reasonable way to assess how sentiment around a company has changed is to compare the earnings per share (EPS) with the share price.
Over half a decade, W.W. Grainger managed to grow its earnings per share at 4.3% a year. This EPS growth is slower than the share price growth of 15% per year, over the same period. This suggests that market participants hold the company in higher regard, these days. That's not necessarily surprising considering the five-year track record of earnings growth.
The graphic below depicts how EPS has changed over time (unveil the exact values by clicking on the image).
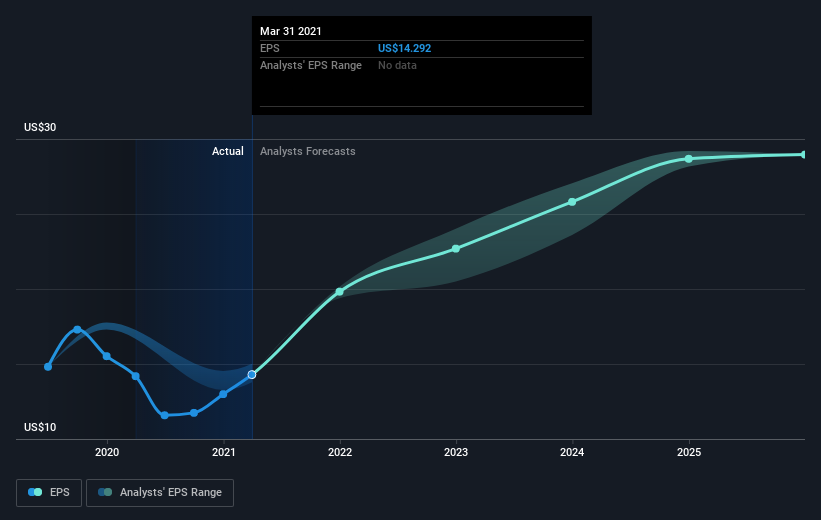
This free interactive report on W.W. Grainger's earnings, revenue and cash flow is a great place to start, if you want to investigate the stock further.
What About Dividends?
As well as measuring the share price return, investors should also consider the total shareholder return (TSR). The TSR incorporates the value of any spin-offs or discounted capital raisings, along with any dividends, based on the assumption that the dividends are reinvested. It's fair to say that the TSR gives a more complete picture for stocks that pay a dividend. In the case of W.W. Grainger, it has a TSR of 125% for the last 5 years. That exceeds its share price return that we previously mentioned. This is largely a result of its dividend payments!
A Different Perspective
It's nice to see that W.W. Grainger shareholders have received a total shareholder return of 48% over the last year. And that does include the dividend. Since the one-year TSR is better than the five-year TSR (the latter coming in at 18% per year), it would seem that the stock's performance has improved in recent times. In the best case scenario, this may hint at some real business momentum, implying that now could be a great time to delve deeper. It's always interesting to track share price performance over the longer term. But to understand W.W. Grainger better, we need to consider many other factors. Case in point: We've spotted 2 warning signs for W.W. Grainger you should be aware of.
Of course W.W. Grainger may not be the best stock to buy. So you may wish to see this free collection of growth stocks.
Please note, the market returns quoted in this article reflect the market weighted average returns of stocks that currently trade on US exchanges.
This article by Simply Wall St is general in nature. It does not constitute a recommendation to buy or sell any stock, and does not take account of your objectives, or your financial situation. We aim to bring you long-term focused analysis driven by fundamental data. Note that our analysis may not factor in the latest price-sensitive company announcements or qualitative material. Simply Wall St has no position in any stocks mentioned.
Have feedback on this article? Concerned about the content? Get in touch with us directly. Alternatively, email editorial-team (at) simplywallst.com.
