
 Yahoo Finance
 Did You Participate In Any Of Avery Dennison's (NYSE:AVY) Fantastic 216% Return ?
The worst result, after buying shares in a company (assuming no leverage), would be if you lose all the money you put in. But on the bright side, if you buy shares in a high quality company at the right price, you can gain well over 100%. Long term Avery Dennison Corporation (NYSE:AVY) shareholders would be well aware of this, since the stock is up 188% in five years. It's also good to see the share price up 24% over the last quarter. The company reported its financial results recently; you can catch up on the latest numbers by reading our company report.
See our latest analysis for Avery Dennison
While markets are a powerful pricing mechanism, share prices reflect investor sentiment, not just underlying business performance. One way to examine how market sentiment has changed over time is to look at the interaction between a company's share price and its earnings per share (EPS).
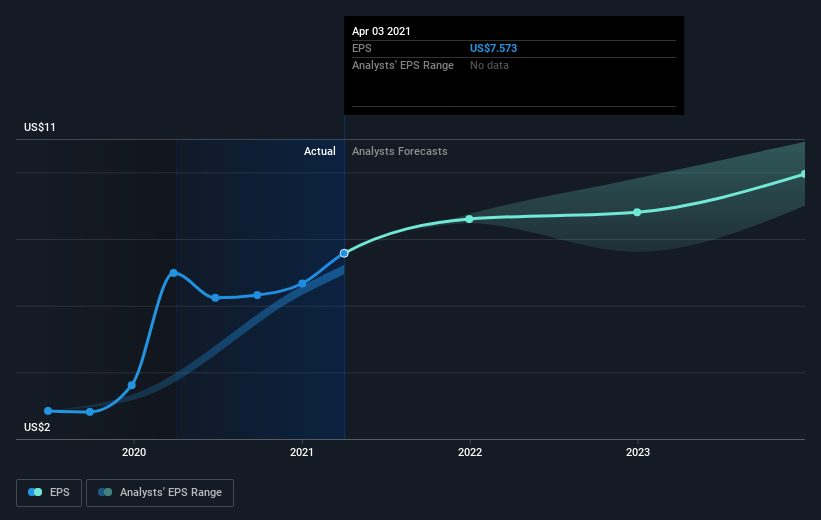
Over half a decade, Avery Dennison managed to grow its earnings per share at 19% a year. This EPS growth is lower than the 24% average annual increase in the share price. So it's fair to assume the market has a higher opinion of the business than it did five years ago. That's not necessarily surprising considering the five-year track record of earnings growth.
You can see how EPS has changed over time in the image below (click on the chart to see the exact values).
We know that Avery Dennison has improved its bottom line over the last three years, but what does the future have in store? If you are thinking of buying or selling Avery Dennison stock, you should check out this FREE detailed report on its balance sheet.
What About Dividends?
It is important to consider the total shareholder return, as well as the share price return, for any given stock. Whereas the share price return only reflects the change in the share price, the TSR includes the value of dividends (assuming they were reinvested) and the benefit of any discounted capital raising or spin-off. Arguably, the TSR gives a more comprehensive picture of the return generated by a stock. In the case of Avery Dennison, it has a TSR of 216% for the last 5 years. That exceeds its share price return that we previously mentioned. This is largely a result of its dividend payments!
A Different Perspective
We're pleased to report that Avery Dennison shareholders have received a total shareholder return of 97% over one year. And that does include the dividend. That gain is better than the annual TSR over five years, which is 26%. Therefore it seems like sentiment around the company has been positive lately. Given the share price momentum remains strong, it might be worth taking a closer look at the stock, lest you miss an opportunity. It's always interesting to track share price performance over the longer term. But to understand Avery Dennison better, we need to consider many other factors. Even so, be aware that Avery Dennison is showing 2 warning signs in our investment analysis , you should know about...
But note: Avery Dennison may not be the best stock to buy. So take a peek at this free list of interesting companies with past earnings growth (and further growth forecast).
Please note, the market returns quoted in this article reflect the market weighted average returns of stocks that currently trade on US exchanges.
This article by Simply Wall St is general in nature. It does not constitute a recommendation to buy or sell any stock, and does not take account of your objectives, or your financial situation. We aim to bring you long-term focused analysis driven by fundamental data. Note that our analysis may not factor in the latest price-sensitive company announcements or qualitative material. Simply Wall St has no position in any stocks mentioned.
Have feedback on this article? Concerned about the content? Get in touch with us directly. Alternatively, email editorial-team (at) simplywallst.com.
